
An S&P 500 straddle bought on an Interactive Brokers paper account and delta hedged with Micro E-mini futures, live for one afternoon. Straddle, gamma, theta and the hedge band, with charts, code and the real fills.
Engine, greeks, hedge band and an offline test with replayed days are in the repository. Behind the dashboard button sits the desk from the reel: a simulated session that starts from the bot's entry on 2 Nov, where every variable can be dragged and every hedge shows up on the chart.
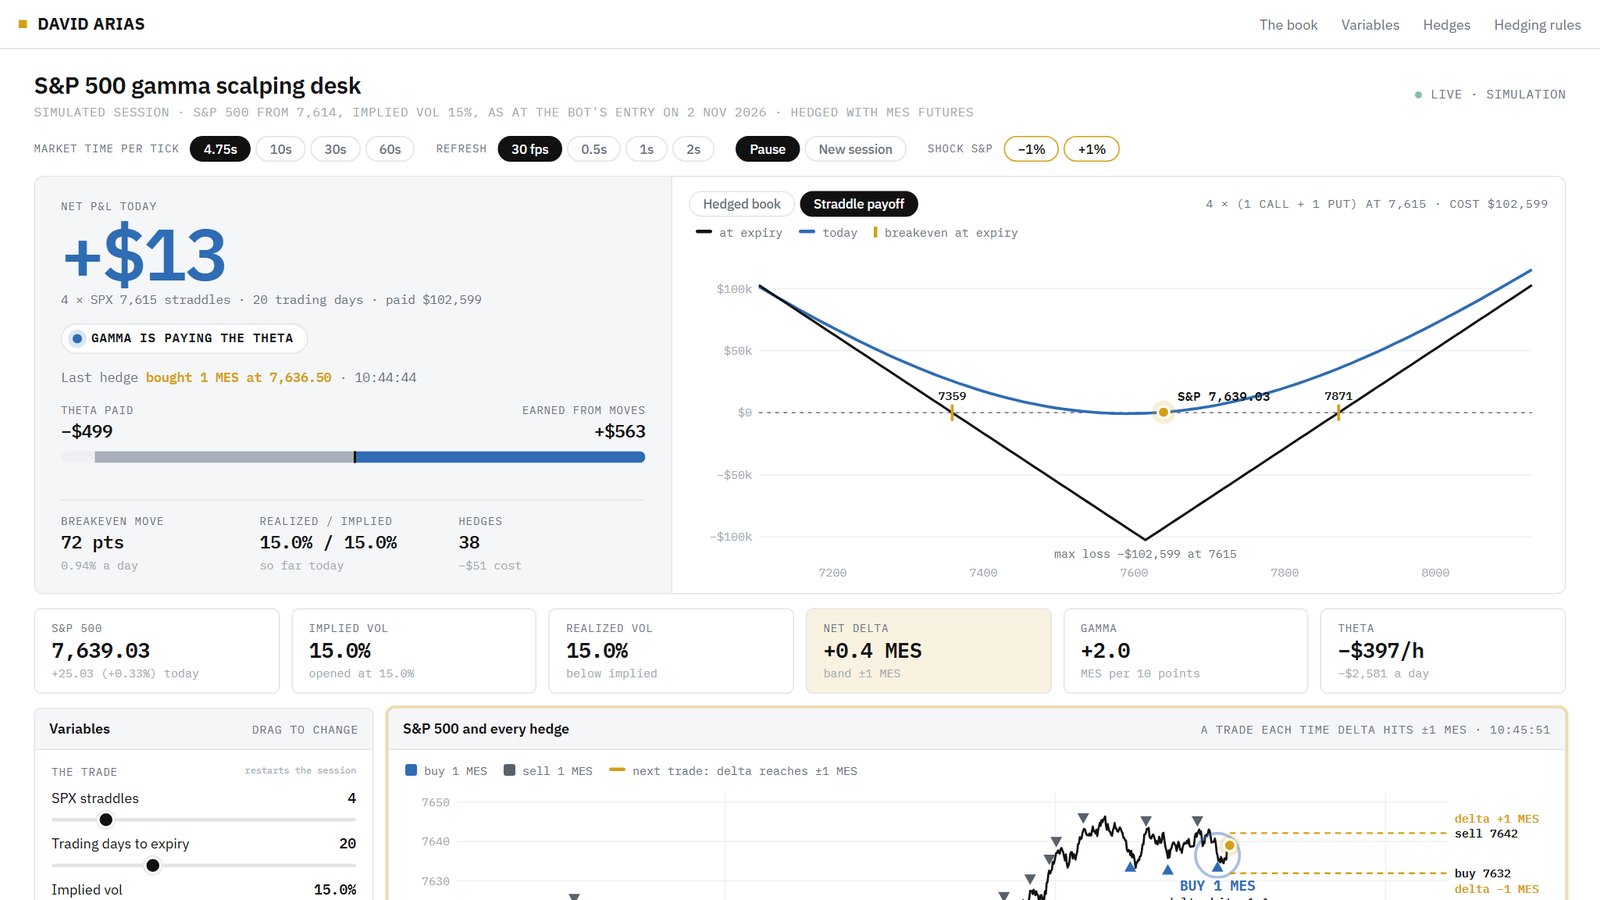
Open the gamma scalping desk: shock the S&P by 1%, change the band or the implied vol, and watch theta and gamma trade places.
Gamma scalping buys a position that gains from movement, then trades the underlying to keep its delta near zero. Here that position is one at the money SPX straddle (a call and a put on the same strike and expiry), and the hedge is Micro E-mini S&P 500 futures (MES). Each time the index moves far enough for delta to reach 1 MES, the bot trades 1 MES back: it sells after a rally and buys after a drop. Every round trip locks in a small gain, and those gains have to pay the option's time decay.
--demo flag trades anyway.--minutes.Paper account only. No real money has gone through it, and research on buying these straddles is not encouraging: Coval and Shumway (2001) find at the money S&P 500 straddles lose about 3% a week on average, because implied vol usually sits above the vol that follows. Read the limitations before using any number here.
Fifteen minutes: the straddle, gamma, theta and the hedge band, then this engine running on a paper account for an afternoon, and the P&L taken apart leg by leg. Subtitles in English, Portuguese and Spanish.
I post the models as I build them, the changes I make to them, and the results that did not work. Shorter than these write ups, and there are a lot more of them.
Follow me on X


Each section below takes one piece of the trade: its chart, its numbers
from the 2 Nov run, and the function in gamma_core.py that computes it.
At 12:27 New York time on 2 Nov 2026 the bot bought the SPXW 7,615 straddle expiring 30 Nov, 28 days out: call 136.60 plus put 117.00, so 253.6 index points, or $25,360 with the $100 multiplier. Implied vol on the fill was 15.0%.
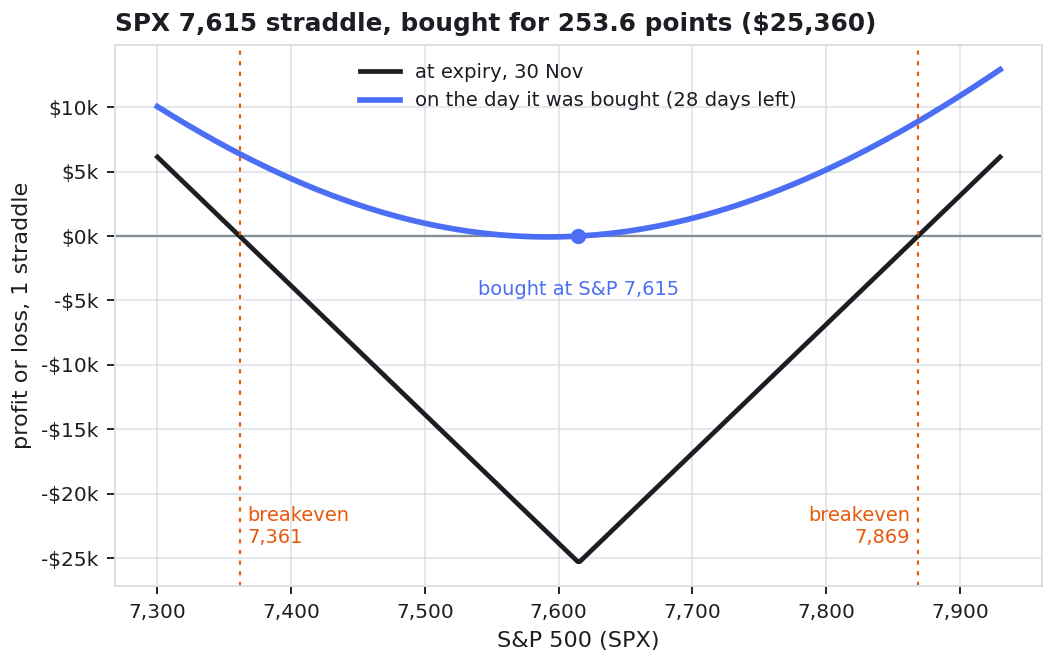
Held to expiry, it only makes money beyond 7,361 or 7,869, a 3.3% move either way. Before expiry, though, the blue curve bends upward on both sides of the strike. That curvature is gamma, and gamma scalping collects it every day by trading futures, long before expiry.
Straddle greeks, Black-Scholes (gamma_core.py)
def straddle(s, k, t, vol, r, q, n=1):
    """1 call + 1 put; t in trading-day years, so theta is per trading day."""
    sd = vol * math.sqrt(t)
    d1 = (math.log(s / k) + (r - q + 0.5 * vol * vol) * t) / sd
    d2 = d1 - sd
    dq, dr = math.exp(-q * t), math.exp(-r * t)
    call = s * dq * N(d1) - k * dr * N(d2)
    put = k * dr * N(-d2) - s * dq * N(-d1)
    delta = dq * (N(d1) - N(-d1))                 # call delta + put delta
    gamma = 2 * dq * pdf(d1) / (s * sd)
    common = -s * dq * pdf(d1) * vol / (2 * math.sqrt(t))
    th_call = common + q * s * dq * N(d1) - r * k * dr * N(d2)
    th_put = common - q * s * dq * N(-d1) + r * k * dr * N(-d2)
    m = 100 * n                                   # SPX multiplier
    return Greeks(price=call + put, delta=delta * m, gamma=gamma * m,
theta_day=(th_call + th_put) / 252 * m)Delta is counted in MES. One MES pays $5 a point, so it equals 5 SPX deltas. With gamma at 0.25, the straddle's delta changes by 0.25 for every point the index moves, so 20 points move it by 5 SPX deltas: exactly one MES. At entry the straddle sat at +1.09 MES (a call slightly above 0.5 delta), and the first order sold 1 MES to bring it back near zero.
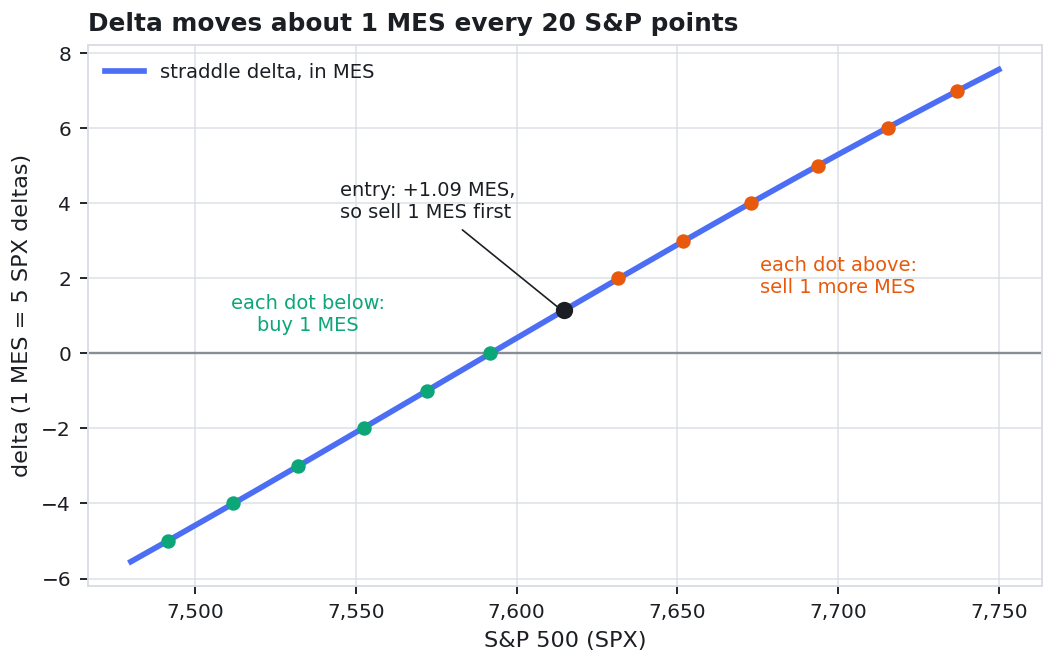
Hedging on every tick would pay commissions all day; hedging rarely lets delta run. Whalley and Wilmott (1997) give the band that balances hedging cost against hedging error, and for this straddle it lands at about one contract. So the rule is simple: trade only when net delta leaves plus or minus 1 MES, then trade back to the nearest whole contract.
Net delta, the band rule and the next trigger levels
MES_MULT = 5.0   # 1 MES = $5 a point = 5 SPX deltas

def net_delta(straddle_delta, mes_position):
    """Dollars per point: options plus the MES hedge."""
    return straddle_delta + MES_MULT * mes_position

def hedge_order(net, band_mes=1.0):
    """MES to trade (+ buy, - sell) once net delta leaves the band."""
    if abs(net) < band_mes * MES_MULT:
        return 0
    return -int(round(net / MES_MULT))

def next_levels(s, net, gamma, band_mes=1.0):
    """S&P levels where net delta reaches -band and +band."""
    edge = band_mes * MES_MULT
return s + (-edge - net) / gamma, s + (edge - net) / gammaOwning gamma costs theta. Time alone took about $648 a trading day off this straddle. A move of size ΔS earns roughly ½ × gamma × ΔS² from the hedges, so the two cancel at one specific daily move:
½ × 0.25 × 72² ≈ $648 so the breakeven is about 72 S&P points a day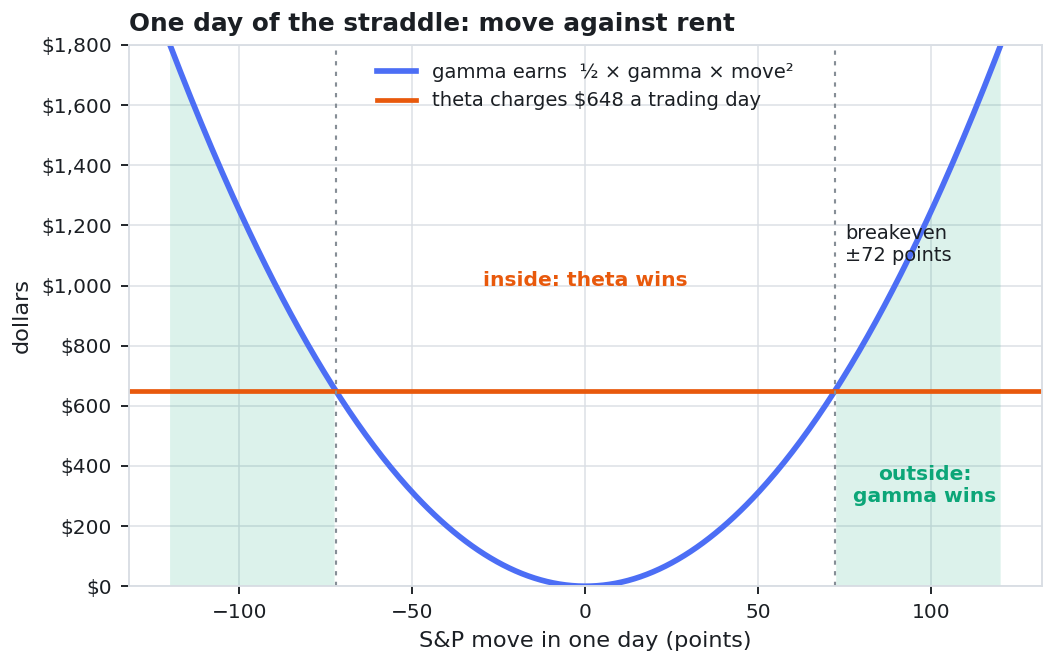
Carr and Madan (1998) put the same idea in vol terms: a delta hedged option earns when
realized vol beats the implied vol paid for it. That is why the bot checks the Goyal and
Saretto filter first. On 2 Nov realized vol was only 0.79 of implied, so the filter said no,
and the run went ahead with --demo to show the mechanics.
Breakeven move and realized vol
def breakeven_move(g):
    """Daily index move whose gamma P&L, 1/2 gamma dS^2, pays one day of theta."""
    return math.sqrt(2 * abs(g.theta_day) / g.gamma)

def realized_vol(closes):
    """Annualised close to close volatility."""
    rets = [math.log(b / a) for a, b in zip(closes, closes[1:])]
    m = sum(rets) / len(rets)
    var = sum((x - m) ** 2 for x in rets) / (len(rets) - 1)
return math.sqrt(var * 252)After the first hedge, nothing happened for 93 minutes: the S&P drifted inside the band. Both buys came between 14:00 and 14:21, when the index broke lower and delta reached minus 1 MES twice. At 15:01 the hedge was closed, and the options a few minutes later.
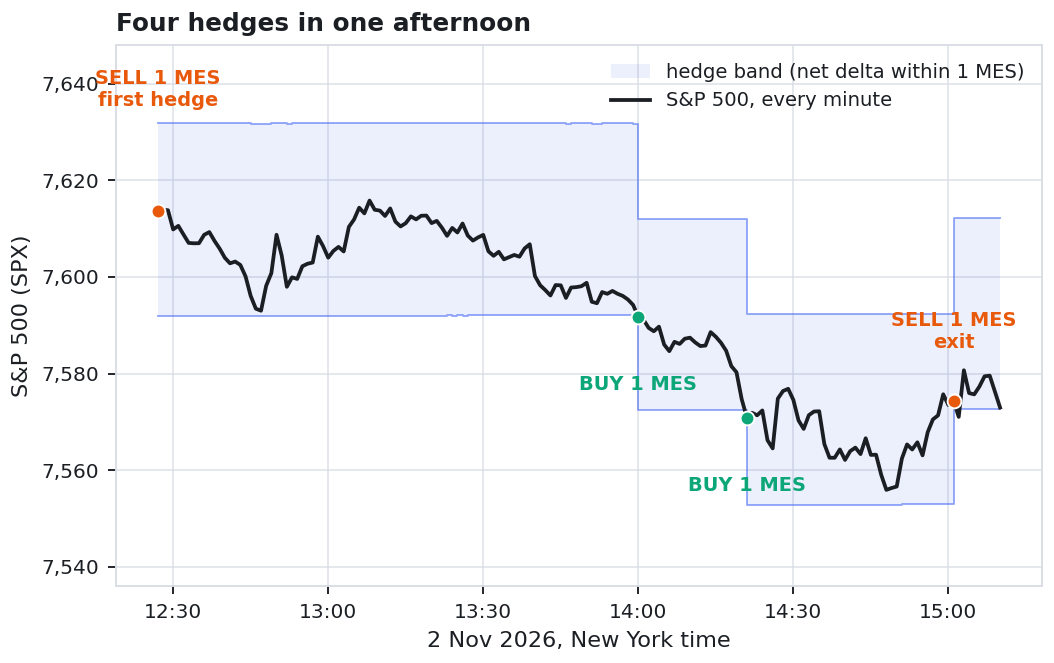
| Time | S&P 500 | Trade | MES price | Why |
|---|---|---|---|---|
| 12:27 | 7,614.82 | sell 1 | 7,647.00 | first hedge, delta +1.09 MES |
| 14:00 | 7,592.11 | buy 1 | 7,623.25 | delta reached -1 MES |
| 14:21 | 7,571.99 | buy 1 | 7,602.75 | delta reached -1 MES again |
| 15:01 | 7,573.97 | sell 1 | 7,606.75 | exit |
Gamma barely moved all afternoon (0.250 at entry, 0.254 at the close), because at 28 days a straddle's gamma is nearly flat across a 50 point range. So every 20 points kept meaning one MES, and the band never needed resizing.
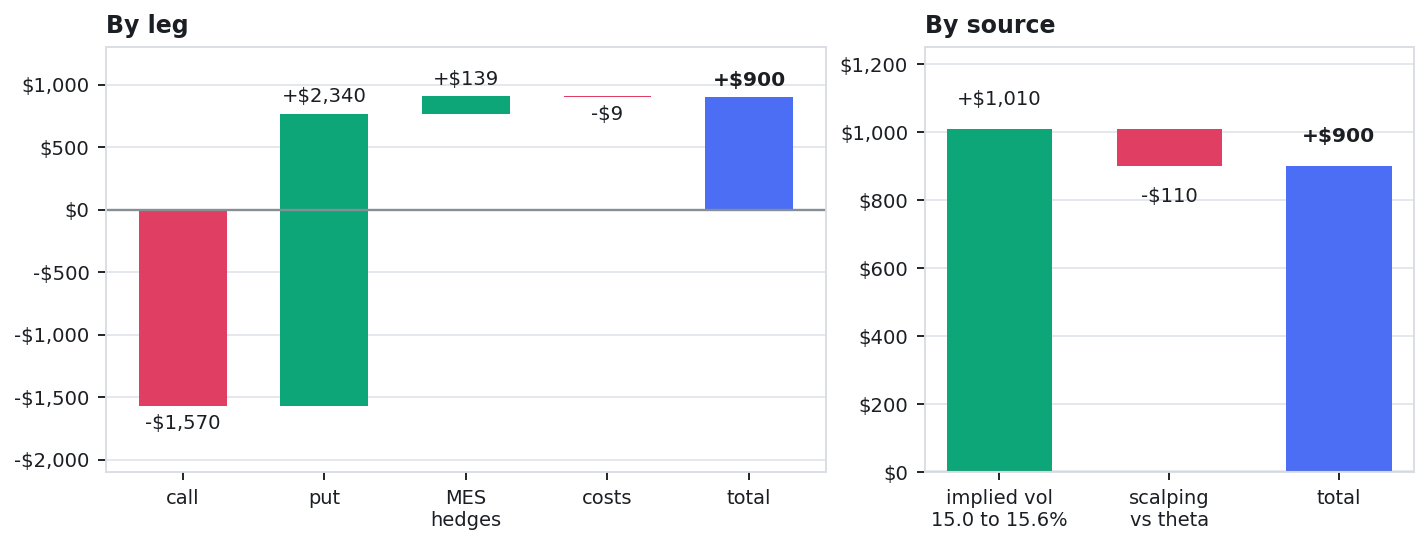
| Leg | Bought | Sold | P&L |
|---|---|---|---|
| Call 7,615 | 136.60 | 120.90 | -$1,570.00 |
| Put 7,615 | 117.00 | 140.40 | +$2,340.00 |
| MES hedges | 4 trades | +$138.75 | |
| Commissions | 8 orders | -$8.96 | |
| Total | +$899.79 | ||
Most of the profit came from vol. As the S&P fell 37 points, implied vol rose from 15.0% to 15.6%. With vega near $1,700 per vol point, those 0.6 points were worth about $1,010. Strip that out and gamma plus the hedges against theta lost about $110: realized vol during the run was 10.9% against 15% implied, exactly the case Carr and Madan describe. One afternoon says nothing about the strategy's edge. What it shows is every moving part with real fills.
Full code in the repository. TWS or IB Gateway on a paper account with the API enabled; the offline test needs neither.
Clone and run
git clone https://github.com/davidalmeida90/GEX-scalping-tradingbot
cd GEX-scalping-tradingbot
pip install -r requirements.txt
cd gamma_scalping
python test_offline.py                    # the math and three replayed days, no TWS
python gamma_engine.py --check            # market, filter and the straddle it would buy
python gamma_engine.py                    # dry run, simulated fills
python gamma_engine.py --paper            # orders on the paper account
python gamma_engine.py --paper --demo     # trade even when the filter says no
Options: --expiry YYYYMMDD, --band 1.0 (half width in MES), --qty 1, --minutes 30, --resume. Every trade is appended to out/gamma_trades.csv.