
Buy the strangle, sell the straddle, and size the wings so vega is exactly zero. What is left on the book is volga, the second derivative of value against volatility. This page builds the position from scratch, shows how many strangles the vega match actually costs you, and finds where the convexity peaks in every vol regime.


Take the value of an options position and expand it in the volatility move. Not in spot, in vol. The Taylor series gives you one term per order of sensitivity:
$$\Delta V \;=\; \underbrace{\mathcal{V}\,\Delta\sigma}_{\text{vega}} \;+\; \underbrace{\tfrac{1}{2}\,\text{Volga}\,(\Delta\sigma)^2}_{\text{convexity}} \;+\; \underbrace{\tfrac{1}{6}\,\text{Ultima}\,(\Delta\sigma)^3}_{\text{third order}} \;+\; \cdots$$
The first term is the one everybody trades. It is linear, it has a sign, and owning it means having a view on whether vol goes up or down. The second term is the curvature. It is quadratic, so it has no sign, and owning it means being paid whenever vol moves at all.
This page builds a position that deletes the first term. Buy a strangle, sell a straddle, and scale the wings until the vegas cancel exactly. Set $\mathcal{V} = 0$ and the whole expansion collapses to its second term:
$$\Delta V \;\approx\; \tfrac{1}{2}\,\text{Volga}\,(\Delta\sigma)^2, \qquad \text{Volga} \;=\; \frac{\partial^2 V}{\partial \sigma^2} \;=\; \mathcal{V}\,\frac{d_1 d_2}{\sigma}$$
Everything below is the work of making that true and finding out what it is worth. How many strangles the cancellation actually costs you, where the convexity peaks, what it pays for a given vol move, and what you give up in the Greeks nobody mentions.
This page is the write up. The video is the same trade built from nothing on a real SPY chain: the straddle sold, the wings bought, the vega matched to zero, how wide the wings should be, and what it made across nine real volatility shocks since 2010. Click to play it right here, then come back for the numbers.
A long straddle is one call and one put on the same strike, at the money. You pay for both, you have no directional view, and you make money if the underlying moves far enough in either direction to cover the two premiums. It is the cleanest way to be long volatility with a single strike.
A long strangle is the same idea with the strikes pushed apart. The call sits above spot, the put sits below, and both start with no intrinsic value. It costs less than the straddle because you are buying options that are further from where the underlying actually is, and for the same reason it needs a bigger move to pay off at expiry.
Those two structures look like variations on the same trade. They are not. The straddle concentrates everything at one strike, where vega and gamma are at their maximum. The strangle spreads the exposure into the wings, where vega and gamma are small but where something else is large. That something else is the whole subject of this page.
Convexity is a statement about a second derivative. It says that the relationship between two quantities is curved rather than straight, so the sensitivity you measure today is not the sensitivity you will have tomorrow.
Bond traders meet it first. Duration says a bond's price falls by roughly the same amount for every extra basis point of yield. Convexity says duration itself shortens as yields rise, so the price falls a little less than duration predicted and rises a little more. The curvature is worth money and the market charges for it.
Options have the same structure one axis over. Vega tells you how the option's value moves when implied volatility moves. Volga tells you how vega itself moves when implied volatility moves. It is the second derivative of value against vol, and it is the exact analogue of bond convexity:
$$\mathcal{V} \;=\; \frac{\partial V}{\partial \sigma}, \qquad \text{Volga} \;=\; \frac{\partial^2 V}{\partial \sigma^2} \;=\; \mathcal{V}\,\frac{d_1 d_2}{\sigma}$$
Read the right hand side and the behaviour falls out immediately. At the money, $d_1 d_2$ is close to zero, so volga is close to zero. The at the money option has the largest vega of any strike, and at a maximum the slope is flat, so vega barely responds to a change in vol. Move away from the money and $d_1 d_2$ grows quickly. Out of the money options carry almost all of the convexity.
That is the fact this trade is built on. When implied vol rises, an out of the money option does not just gain value, it gains vega, so it keeps gaining faster. The at the money option gains value too, but its vega stands still.
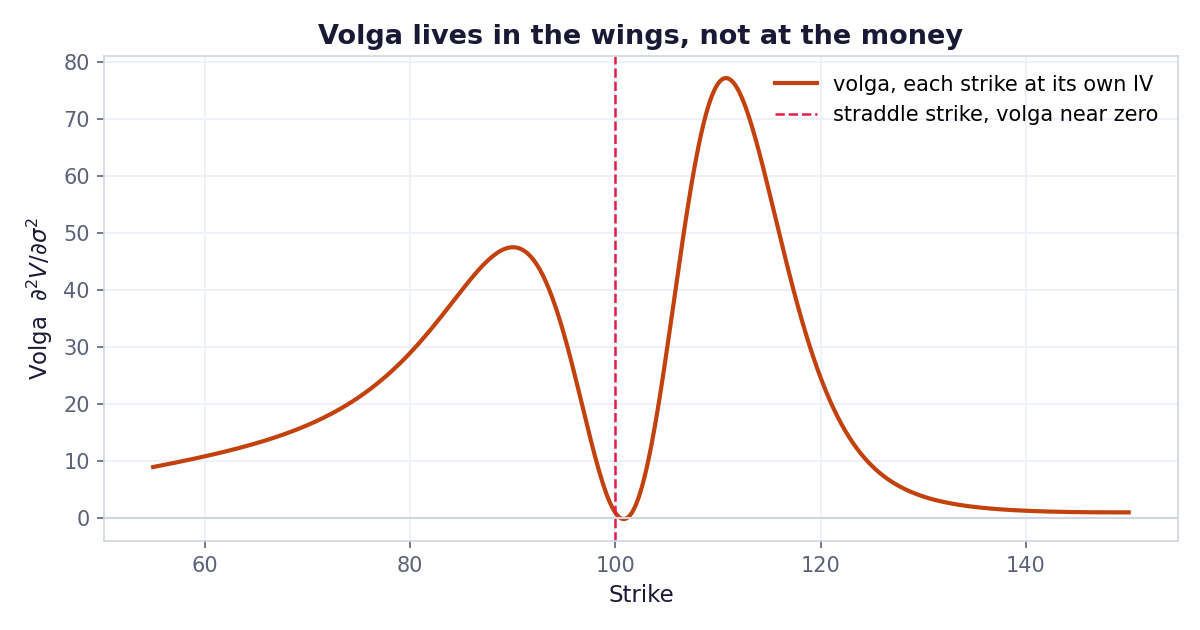
Volga against strike, each strike priced at its own implied vol. Two humps in the wings and a trough at the money, exactly what the d1 d2 term predicts. The put side hump is lower and wider than the call side because the smile prices those strikes at a much higher vol.
If out of the money options own the convexity and at the money options do not, the way to isolate it is obvious. Buy the strangle and sell the straddle at the same time. Long the wings, short the body. That structure already has a name in the market: it is a long iron butterfly, or iron fly.
The textbook iron fly runs one contract per leg. That version is not what we want, because one for one leaves you heavily short vega. The strangle simply does not carry enough vega to offset the straddle, and the further out you push the strikes, the worse the mismatch gets.
The fix is to scale the wings. Buy $\lambda$ strangles for every straddle you sell, with $\lambda$ chosen so the two vegas cancel exactly:
$$\lambda \;=\; \frac{\mathcal{V}_{\text{straddle}}}{\mathcal{V}_{\text{call}}(K_{hi}) + \mathcal{V}_{\text{put}}(K_{lo})}$$
That single ratio is what turns a directional vol bet into a pure convexity position.
Two libraries. numpy for the maths and scipy for the standard
normal. Everything below is closed form Black-Scholes, so nothing here needs a solver
or a simulation.
pip install numpy scipyThe one modelling choice worth explaining is the volatility surface. Pricing every strike at a single flat vol would quietly break the whole exercise, because on a flat surface the identity below forces gamma to cancel whenever vega cancels, and the position becomes cleaner than any real book could ever be. So each strike carries its own implied vol, taken from a quadratic in log moneyness fitted to a real SPY chain. The fit has a residual of 1.2 vol points across 163 quotes, and it reproduces the shape the market actually prints: a steep monotone put wing, and a call wing that dips just above the money before curling back up.
import numpy as np
from scipy.stats import norm

S, R, Q = 100.0, 0.05, 0.0
TAU = 60.0 / 365.0

# Smile fitted to a real SPY chain, quadratic in log moneyness.
# iv(m) = 0.1544 - 0.3159 m + 1.2915 m^2, residual 1.2 vol points over 163 quotes.
A1, A2 = -0.3159, 1.2915


def leg_vol(K, atm):
    """Each strike carries its own implied vol."""
    m = np.log(np.asarray(K, dtype=float) / S)
    return np.maximum(atm + A1 * m + A2 * m * m, 0.05)


def _d(K, sig, tau=TAU):
    d1 = (np.log(S / K) + (R - Q + 0.5 * sig * sig) * tau) / (sig * np.sqrt(tau))
    return d1, d1 - sig * np.sqrt(tau)


def call(K, sig, tau=TAU):
    d1, d2 = _d(K, sig, tau)
    return S * np.exp(-Q * tau) * norm.cdf(d1) - K * np.exp(-R * tau) * norm.cdf(d2)


def put(K, sig, tau=TAU):
    d1, d2 = _d(K, sig, tau)
    return K * np.exp(-R * tau) * norm.cdf(-d2) - S * np.exp(-Q * tau) * norm.cdf(-d1)
Then the three Greeks the trade lives on. Note that volga is written
exactly as the formula above, vega times $d_1 d_2$ over sigma, so you can see the
at the money collapse directly in the code.
def vega(K, sig, tau=TAU):
    d1, _ = _d(K, sig, tau)
    return S * np.exp(-Q * tau) * norm.pdf(d1) * np.sqrt(tau)


def volga(K, sig, tau=TAU):
    """Second derivative of value against vol."""
    d1, d2 = _d(K, sig, tau)
    return vega(K, sig, tau) * d1 * d2 / sig


def gamma(K, sig, tau=TAU):
    d1, _ = _d(K, sig, tau)
return np.exp(-Q * tau) * norm.pdf(d1) / (S * sig * np.sqrt(tau))Vega across strikes is a bell curve centred at the money. An at the money straddle at 18% vol with 60 days left carries vega 31.99. Push the strikes out and the strangle's vega falls off a cliff, so trading the iron fly one for one leaves you short almost the entire straddle's vega.
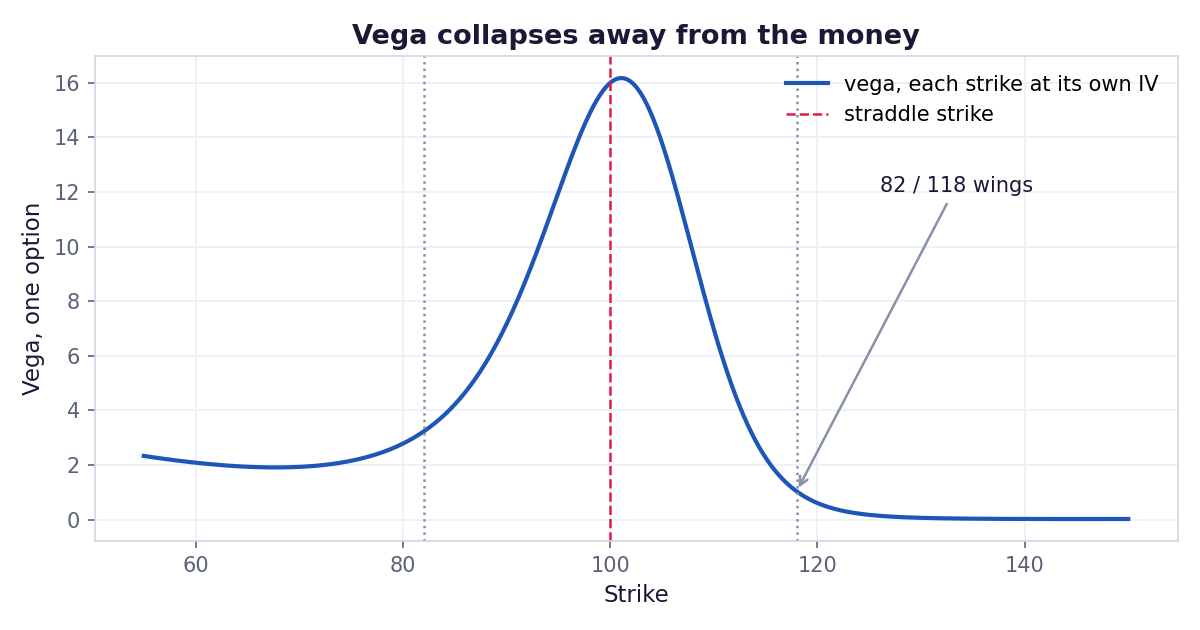
Vega is a bell curve centred at the money. By 82/118 a single option carries roughly a quarter of the vega it has at the strike, which is why one strangle cannot hold up its side of the trade.
output
=== one for one is short vega ===
     strikes  vega 1 stg  net vega 1:1  net volga 1:1  strangles for 0
   95/105          25.78         -6.22           59.6             1.24
   92/108          18.66        -13.33          107.8             1.71
   89/111          12.15        -19.84          122.3             2.63
   86/114           7.57        -24.42          104.4             4.23
   82/118           4.26        -27.73           66.9             7.51
   78/122           2.82        -29.17           40.1            11.34
   72/128           2.07        -29.92           21.3            15.42
   64/136           1.98        -30.01           12.5            16.13
   55/145           2.35        -29.64            8.1            13.61
| Strikes | Vega, 1 strangle | Net vega at 1:1 | Net volga at 1:1 | Strangles for zero vega |
|---|---|---|---|---|
| 95 / 105 | 25.78 | -6.22 | 60 | 1.24 |
| 92 / 108 | 18.66 | -13.33 | 108 | 1.71 |
| 89 / 111 | 12.15 | -19.84 | 122 | 2.63 |
| 86 / 114 | 7.57 | -24.42 | 104 | 4.23 |
| 82 / 118 | 4.26 | -27.73 | 67 | 7.51 |
| 78 / 122 | 2.82 | -29.17 | 40 | 11.34 |
| 72 / 128 | 2.07 | -29.92 | 21 | 15.42 |
| 64 / 136 | 1.98 | -30.01 | 13 | 16.13 |
| 55 / 145 | 2.35 | -29.64 | 8 | 13.61 |
At 82/118 the one for one iron fly is short 27.73 vega against a straddle that only carries 31.99. That is not a convexity trade, it is a short volatility position wearing a hedge that does almost nothing. Worse, look at the volga column: because you only own one strangle, the net convexity peaks at 122 around 89/111 and then falls, so the naive version gives up the exposure it was supposedly built to capture.
Scale the wings by $\lambda$ and everything changes. The function below builds the whole position at a given half width and at a given at the money vol level, and returns every number quoted on this page.
def spread(half, atm=0.18):
    """Long strangle at S +/- half, short straddle at S, wings scaled so net
    vega is zero."""
    kl, kh = S - half, S + half
    sl, sh = float(leg_vol(kl, atm)), float(leg_vol(kh, atm))

    v_std = 2.0 * vega(S, atm)
    o_std = 2.0 * volga(S, atm)
    g_std = 2.0 * gamma(S, atm)
    c_std = call(S, atm) + put(S, atm)

    v_stg = vega(kh, sh) + vega(kl, sl)        # ONE strangle
    o_stg = volga(kh, sh) + volga(kl, sl)
    g_stg = gamma(kh, sh) + gamma(kl, sl)
    c_stg = call(kh, sh) + put(kl, sl)

    lam = v_std / v_stg                        # contracts that flatten vega
    return dict(kl=kl, kh=kh, iv_put=sl, iv_call=sh, lam=lam,
                vega_net=lam * v_stg - v_std,
                volga_net=lam * o_stg - o_std,
                gamma_net=lam * g_stg - g_std,
                credit=c_std - lam * c_stg)
Run it across the same widths and the vega column collapses to zero everywhere, which is the point, while the volga column becomes something worth trading.
| Strikes | Strangles (λ) | Net vega | Net volga | Net gamma | Put IV | Call IV | Credit | Theta / day |
|---|---|---|---|---|---|---|---|---|
| 95 / 105 | 1.24 | 0.00 | 74 | -0.0007 | 20.0% | 16.8% | 3.06 | -0.001 |
| 92 / 108 | 1.71 | 0.00 | 186 | -0.0027 | 21.5% | 16.3% | 3.84 | -0.002 |
| 89 / 111 | 2.63 | 0.00 | 325 | -0.0072 | 23.4% | 16.1% | 4.23 | -0.004 |
| 86 / 114 | 4.23 | 0.00 | 448 | -0.0149 | 25.7% | 16.1% | 4.38 | -0.008 |
| 82 / 118 | 7.51 | 0.00 | 516 | -0.0290 | 29.4% | 16.3% | 4.33 | -0.018 |
| 78 / 122 | 11.34 | 0.00 | 476 | -0.0432 | 33.8% | 16.8% | 4.14 | -0.032 |
| 72 / 128 | 15.42 | 0.00 | 358 | -0.0594 | 42.3% | 18.1% | 3.73 | -0.057 |
| 64 / 136 | 16.13 | 0.00 | 231 | -0.0736 | 57.8% | 20.5% | 2.83 | -0.099 |
| 55 / 145 | 13.61 | 0.00 | 136 | -0.0842 | 83.0% | 24.1% | 1.05 | -0.166 |
Three things in that table matter more than the rest. The vega column is exactly zero at every width, so the position has no view on vol going up or down. The volga column peaks at 516 around 82/118 and fades on both sides of it, which means there is a right answer for how wide to go. And the λ column is the bill: 7.51 strangles per straddle at the peak, 16.13 at 64/136. Every one of those contracts crosses a spread and pays a commission.
The last two columns are the honest part. The structure opens for a credit, but it is short gamma and it bleeds theta, and both get worse as you widen. The convexity is not free, you are paying for it in the two Greeks nobody puts in the headline.
output
     strikes   lambda    vega    volga     gamma   put IV  call IV   credit  theta/day
   95/105        1.24    0.00       74   -0.0007   20.0%    16.8%     3.06     -0.001
   92/108        1.71    0.00      186   -0.0027   21.5%    16.3%     3.84     -0.002
   89/111        2.63    0.00      325   -0.0072   23.4%    16.1%     4.23     -0.004
   86/114        4.23   -0.00      448   -0.0149   25.7%    16.1%     4.38     -0.008
   82/118        7.51    0.00      516   -0.0290   29.4%    16.3%     4.33     -0.018
   78/122       11.34   -0.00      476   -0.0432   33.8%    16.8%     4.14     -0.032
   72/128       15.42    0.00      358   -0.0594   42.3%    18.1%     3.73     -0.057
   64/136       16.13    0.00      231   -0.0736   57.8%    20.5%     2.83     -0.099
   55/145       13.61    0.00      136   -0.0842   83.0%    24.1%     1.05     -0.166

=== the quadratic vs the real reprice, at the peak ===
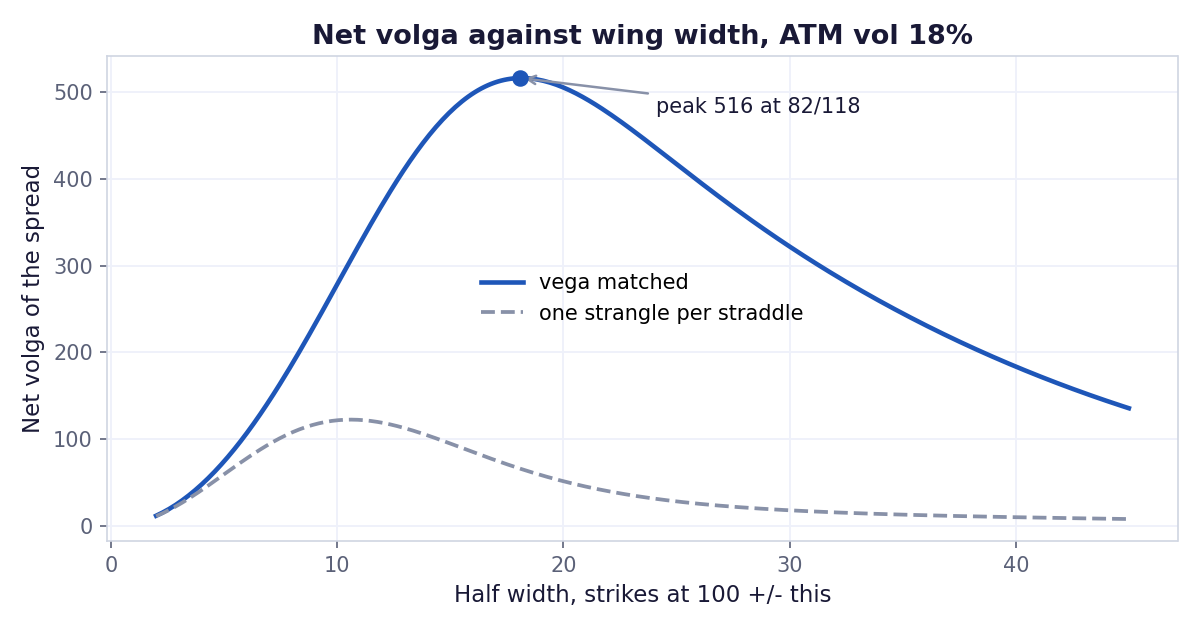
Net volga against the wing width. The vega matched line peaks at 516 around 82/118 and fades on both sides. The dashed line is the one for one iron fly, which tops out at 122 and dies quickly.
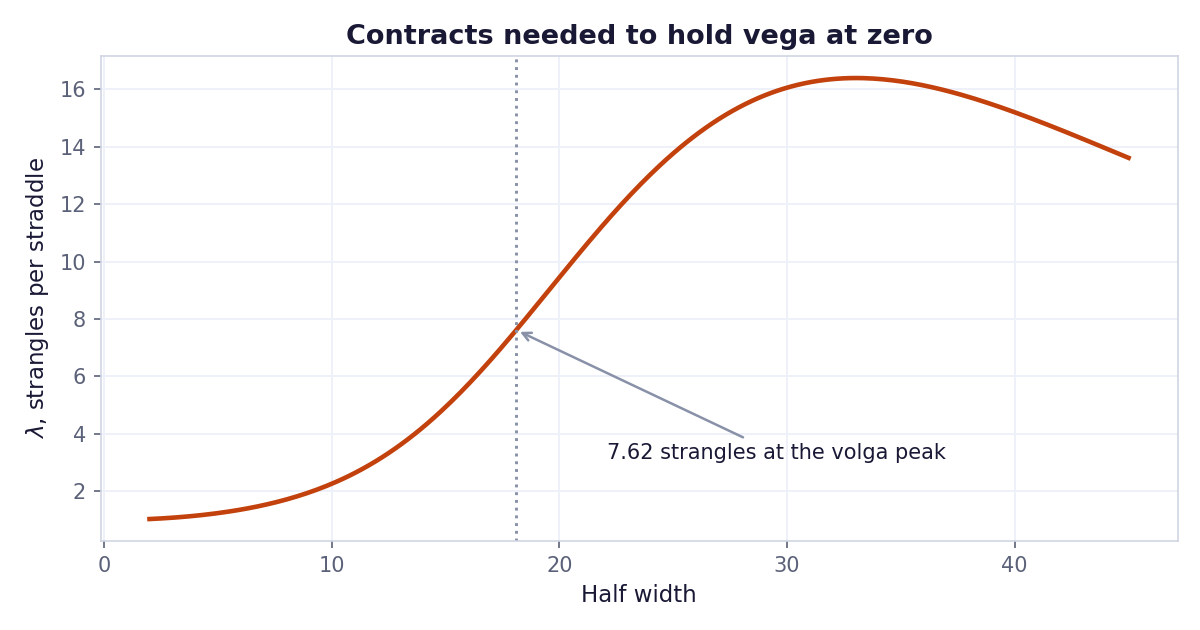
The bill for holding vega at zero. Lambda passes 7.6 at the volga peak and keeps climbing to 16 before the vega of the wings stops falling. Everything past the peak costs more to execute and pays less.
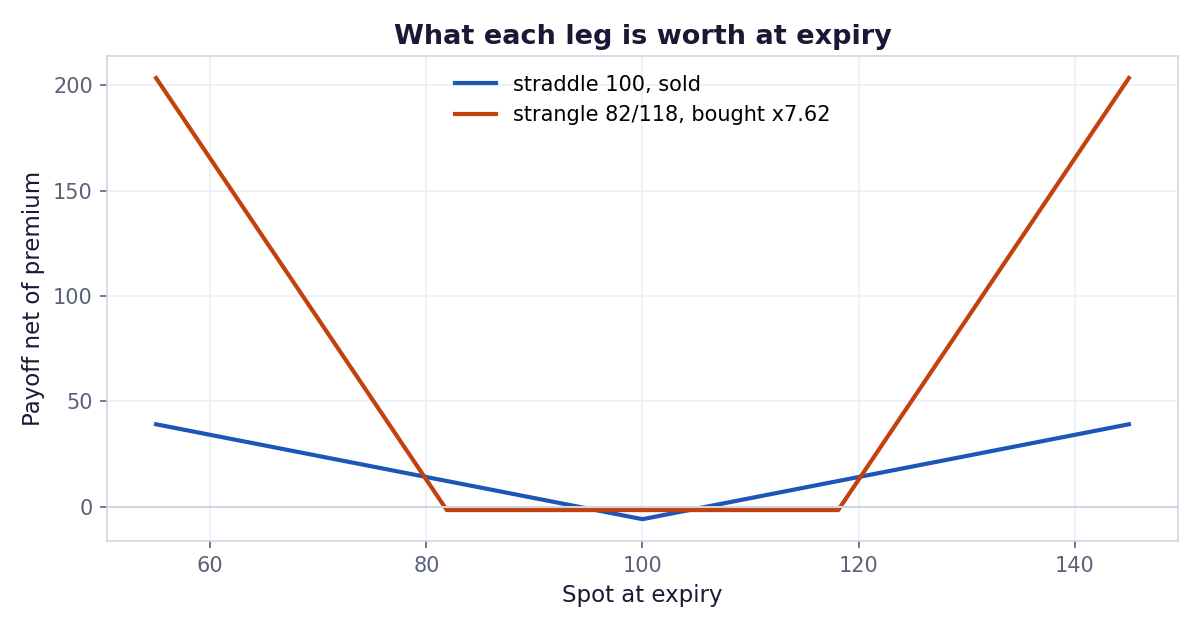
The same position at expiry. The scale is the point: 7.62 strangles is a large number of contracts, and their combined payoff dwarfs the single straddle you sold against them.
Expand the position's value as a Taylor series in the vol move. To second order:
$$\Delta V \;\approx\; \mathcal{V}\,\Delta\sigma \;+\; \tfrac{1}{2}\,\text{Volga}\,(\Delta\sigma)^2$$
We built the position so that $\mathcal{V} = 0$. The first term vanishes and the whole P&L collapses to the second:
$$\Delta V \;\approx\; \tfrac{1}{2}\,\text{Volga}\,(\Delta\sigma)^2$$
The move is squared, so its sign disappears. Vol up or vol down, a long volga position collects either way. That is what people mean when they say a trade is long convexity rather than long volatility.
It is worth checking the approximation against a real reprice rather than trusting it. The function below shifts every leg's implied vol and prices the structure again, no Taylor series involved.
def repriced(half, dsig, atm=0.18):
    """Actual P&L after a parallel shift in implied vol, priced leg by leg."""
    b = spread(half, atm)
    kl, kh, lam = b["kl"], b["kh"], b["lam"]

    def val(bump):
        stg = lam * (call(kh, b["iv_call"] + bump) + put(kl, b["iv_put"] + bump))
        std = call(S, atm + bump) + put(S, atm + bump)
        return stg - std

    return val(dsig) - val(0.0)
At the peak width, 82/118 with volga 516:
| Vol move | ½ · Volga · (Δσ)² | Repriced | Gap |
|---|---|---|---|
| +2 points | 0.10 | 0.11 | 0.01 |
| +5 points | 0.64 | 0.71 | 0.07 |
| +10 points | 2.58 | 2.94 | 0.36 |
| +15 points | 5.80 | 6.58 | 0.78 |
The quadratic tracks well and reads slightly low every time. The gap is the third derivative, ultima, which is positive here, so the true curve bends up a little more than the second order term says. For small moves you can ignore it. At 15 vol points it is 12% of the answer, which is the point at which you should stop using the approximation and just reprice.
output
  vol move  0.5 x volga x dsig^2    repriced     gap
       +2%                  0.10        0.11    0.01
       +5%                  0.64        0.71    0.07
      +10%                  2.58        2.94    0.36
      +15%                  5.80        6.58    0.78

=== vol regime: where the convexity lives ===
  ATM vol     95/105     92/108     89/111     86/114     82/118     78/122     72/128     64/136     55/145
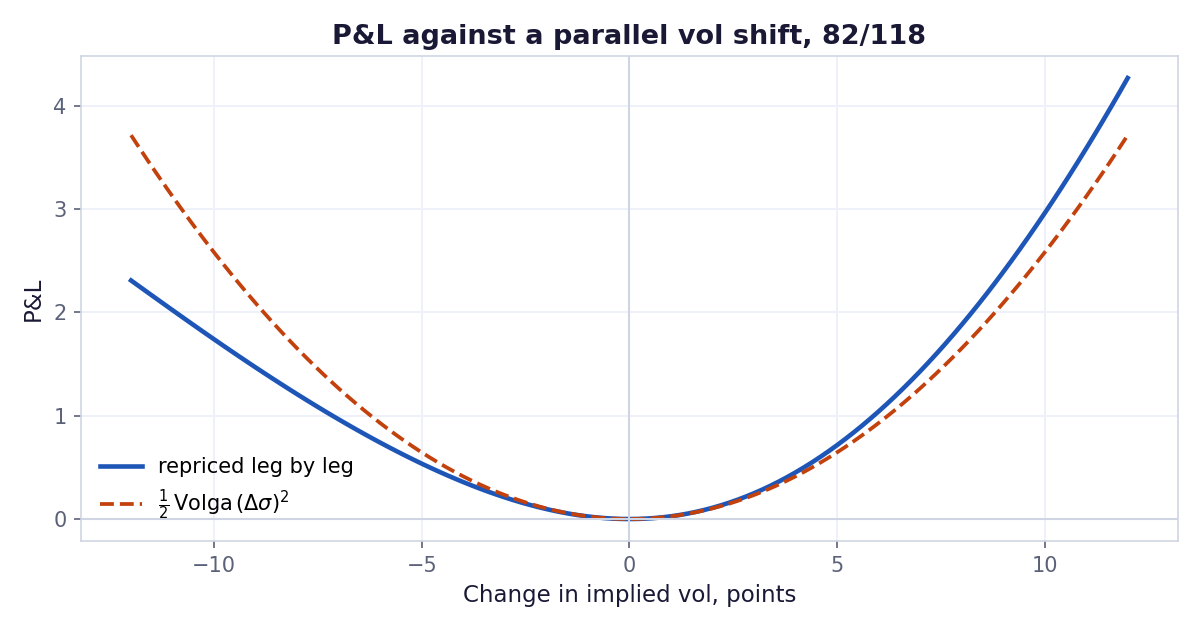
The bowl the whole trade is built on. Both sides pay, which is what a squared term means. The quadratic sits above the truth on the downside and below it on the upside, because the smile makes the position slightly asymmetric in vol.
The peak at 82/118 is not a universal constant. It is the answer for an 18% at the money vol with 60 days left. Change the vol regime and both the size of the prize and the strikes that capture it move.
The reason is in $d_1 d_2 / \sigma$. A strike's distance from the money is what matters, measured in standard deviations, not in dollars. Raise vol and every strike moves closer to the money in that metric, so its $d_1 d_2$ shrinks. You have to walk further out to find the same curvature, and by the time you get there each option's vega has collapsed so far that you cannot buy enough of them.
Net volga after the vega match, across regimes:
| ATM vol | 95/105 | 92/108 | 89/111 | 86/114 | 82/118 | 78/122 | 72/128 | 64/136 | 55/145 |
|---|---|---|---|---|---|---|---|---|---|
| 12% | 246 | 602 | 853 | 816 | 680 | 590 | 450 | 279 | 147 |
| 15% | 127 | 318 | 529 | 647 | 608 | 502 | 375 | 244 | 137 |
| 18% | 74 | 186 | 325 | 448 | 516 | 476 | 358 | 231 | 136 |
| 22% | 41 | 103 | 184 | 269 | 358 | 392 | 351 | 245 | 151 |
| 28% | 20 | 51 | 91 | 138 | 198 | 245 | 273 | 243 | 177 |
| 35% | 11 | 26 | 48 | 73 | 108 | 141 | 176 | 188 | 166 |
Read it along the diagonal. The best cell in every row sits further out than the row above it, and it is smaller. Searching on a finer grid pins it down:
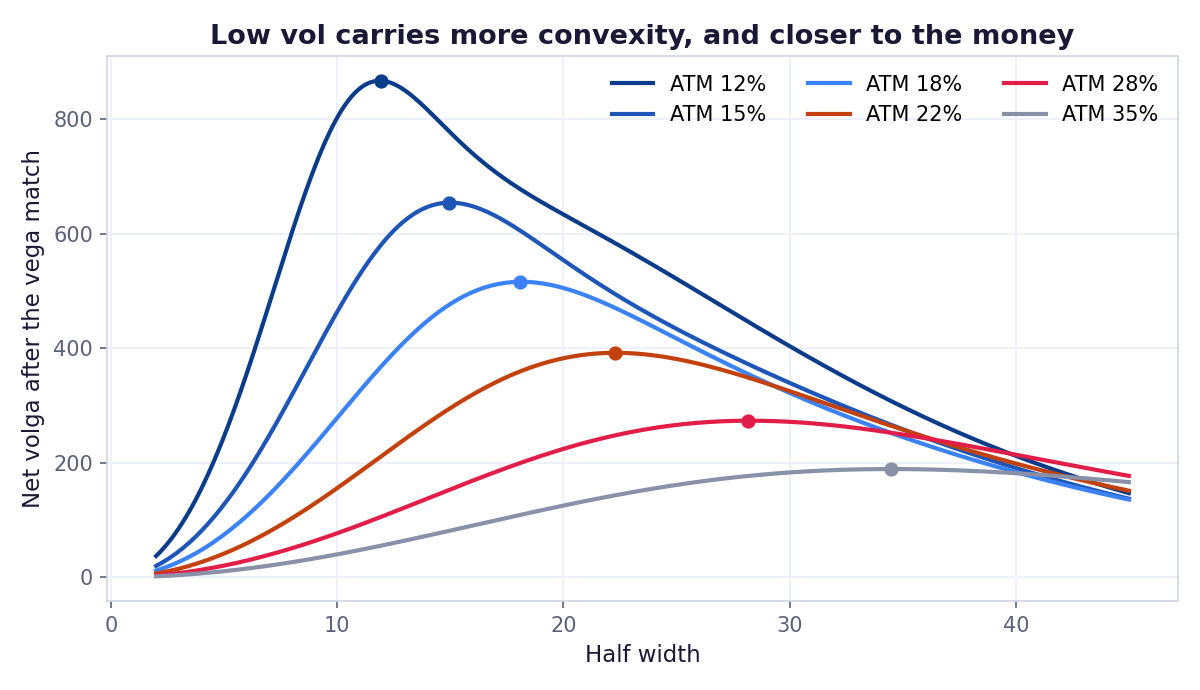
Six vol regimes on one axis. As at the money vol rises the whole curve flattens and its peak slides to the right, so you get less convexity and you have to go further out of the money to find it.
output
      15%        127        318        529        647        608        502        375        244        137
      18%         74        186        325        448        516        476        358        231        136
      22%         41        103        184        269        358        392        351        245        151
      28%         20         51         91        138        198        245        273        243        177
      35%         11         26         48         73        108        141        176        188        166

peak width by regime
  ATM 12%  peaks at 88/112  volga 867  lambda 9.46
  ATM 15%  peaks at 85/115  volga 654  lambda 8.39
  ATM 18%  peaks at 82/118  volga 516  lambda 7.51
  ATM 22%  peaks at 78/122  volga 392  lambda 6.86
  ATM 28%  peaks at 72/128  volga 273  lambda 5.46
  ATM 35%  peaks at 66/134  volga 189  lambda 4.45
| ATM vol | Best strikes | Volga at the peak | Strangles needed |
|---|---|---|---|
| 12% | 88 / 112 | 867 | 9.46 |
| 15% | 85 / 115 | 654 | 8.39 |
| 18% | 82 / 118 | 516 | 7.51 |
| 22% | 78 / 122 | 392 | 6.86 |
| 28% | 72 / 128 | 273 | 5.46 |
| 35% | 66 / 134 | 189 | 4.45 |
Low vol is where the convexity is. At 12% you can own 867 volga with strikes only 12% away from spot. At 35% the same trade gives you 189 and you have to go 34% out to get it. That is a 4.6x difference in the size of the payoff for the same vega neutral structure.
Which is convenient, because low vol is also when you want the trade on. A quiet tape is when implied vol has the most room to expand and when the market charges least for the wings. The structure and the opportunity line up. The one consolation in a high vol regime is the last column: λ falls from 9.46 to 4.45, so the position is cheaper to execute even though there is less to win.
There is an identity hiding underneath all of this that is worth knowing, because it explains why the gamma column in section 6 is small but not zero.
$$\mathcal{V} \;=\; \Gamma\, S^2 \sigma \tau$$
Vega and gamma are the same quantity wearing different clothes. If every leg is priced at the same sigma and the same maturity, then matching total vega forces total gamma to match as well, because the two sums are proportional with the identical constant. On a flat surface this position would be vega neutral and gamma neutral at once, for free.
A real chain is not flat. Each leg carries its own $\sigma_i$, and the vega sum becomes a sigma weighted sum of gammas:
$$\mathcal{V}_{\text{total}} \;=\; S^2 \tau \sum_i \Gamma_i\, \sigma_i$$
Setting that to zero no longer sets $\sum_i \Gamma_i$ to zero, and the size of the leftover is a direct measurement of the skew between the strikes you traded. In the table above the residual gamma runs from -0.0007 at 95/105, where the two legs are priced 3 vol points apart, to -0.0842 at 55/145, where the put wing is at 83% and the call wing is at 24%. The skew is doing that, nothing else.
Practically, this is why the trade is short gamma. You are long a lot of wings priced at high implied vol and short a body priced at low implied vol, and the vega match overweights the wings' vol rather than their gamma. That is the exposure you carry into any large spot move, and it is why the P&L surface for this structure is a bowl in the vol direction but slopes away in the spot direction.
Everything above in one file. Run it and it prints all four tables on this page.
"""Vega neutral volga spread.

Long strangle, short straddle, wings sized so total vega is exactly zero. What is
left on the book is the second derivative of value against volatility.
"""
import numpy as np
from scipy.stats import norm

S, R, Q = 100.0, 0.05, 0.0
TAU = 60.0 / 365.0

# Smile fitted to a real SPY chain, quadratic in log moneyness.
# iv(m) = 0.1544 - 0.3159 m + 1.2915 m^2, residual 1.2 vol points over 163 quotes.
A1, A2 = -0.3159, 1.2915


def leg_vol(K, atm):
    """Each strike carries its own implied vol. The put wing is steep and monotone,
    the call wing dips then curls back up, which is what the market quotes."""
    m = np.log(np.asarray(K, dtype=float) / S)
    return np.maximum(atm + A1 * m + A2 * m * m, 0.05)


def _d(K, sig, tau=TAU):
    d1 = (np.log(S / K) + (R - Q + 0.5 * sig * sig) * tau) / (sig * np.sqrt(tau))
    return d1, d1 - sig * np.sqrt(tau)


def call(K, sig, tau=TAU):
    d1, d2 = _d(K, sig, tau)
    return S * np.exp(-Q * tau) * norm.cdf(d1) - K * np.exp(-R * tau) * norm.cdf(d2)


def put(K, sig, tau=TAU):
    d1, d2 = _d(K, sig, tau)
    return K * np.exp(-R * tau) * norm.cdf(-d2) - S * np.exp(-Q * tau) * norm.cdf(-d1)


def vega(K, sig, tau=TAU):
    d1, _ = _d(K, sig, tau)
    return S * np.exp(-Q * tau) * norm.pdf(d1) * np.sqrt(tau)


def volga(K, sig, tau=TAU):
    """Second derivative of value against vol. Vega times d1 d2 over sigma."""
    d1, d2 = _d(K, sig, tau)
    return vega(K, sig, tau) * d1 * d2 / sig


def gamma(K, sig, tau=TAU):
    d1, _ = _d(K, sig, tau)
    return np.exp(-Q * tau) * norm.pdf(d1) / (S * sig * np.sqrt(tau))


def theta_call(K, sig, tau=TAU):
    """Per year. Negative means the option bleeds."""
    d1, d2 = _d(K, sig, tau)
    return (-S * norm.pdf(d1) * sig / (2.0 * np.sqrt(tau))
            - R * K * np.exp(-R * tau) * norm.cdf(d2))


def theta_put(K, sig, tau=TAU):
    d1, d2 = _d(K, sig, tau)
    return (-S * norm.pdf(d1) * sig / (2.0 * np.sqrt(tau))
            + R * K * np.exp(-R * tau) * norm.cdf(-d2))


def spread(half, atm=0.18):
    """Long strangle at S +/- half, short straddle at S, wings scaled so net vega
    is zero. Returns every number the write-up quotes."""
    kl, kh = S - half, S + half
    sl, sh = float(leg_vol(kl, atm)), float(leg_vol(kh, atm))

    v_std = 2.0 * vega(S, atm)
    o_std = 2.0 * volga(S, atm)
    g_std = 2.0 * gamma(S, atm)
    c_std = call(S, atm) + put(S, atm)

    v_stg = vega(kh, sh) + vega(kl, sl)        # ONE strangle
    o_stg = volga(kh, sh) + volga(kl, sl)
    g_stg = gamma(kh, sh) + gamma(kl, sl)
    c_stg = call(kh, sh) + put(kl, sl)
    t_std = theta_call(S, atm) + theta_put(S, atm)
    t_stg = theta_call(kh, sh) + theta_put(kl, sl)   # the actual two wing legs

    lam = v_std / v_stg                         # contracts that flatten vega
    return dict(kl=kl, kh=kh, iv_put=sl, iv_call=sh, lam=lam,
                vega_1=v_stg, vega_std=v_std,
                vega_net_1x1=v_stg - v_std, volga_net_1x1=o_stg - o_std,
                vega_net=lam * v_stg - v_std,
                volga_net=lam * o_stg - o_std,
                gamma_net=lam * g_stg - g_std,
                cost_std=c_std, cost_stg=lam * c_stg,
                credit=c_std - lam * c_stg,
                theta_net=(lam * t_stg - t_std) / 365.0)


def repriced(half, dsig, atm=0.18):
    """Actual P&L of the structure after a parallel shift in implied vol, priced
    leg by leg. No approximation."""
    b = spread(half, atm)
    kl, kh, lam = b["kl"], b["kh"], b["lam"]

    def val(bump):
        stg = lam * (call(kh, b["iv_call"] + bump) + put(kl, b["iv_put"] + bump))
        std = call(S, atm + bump) + put(S, atm + bump)
        return stg - std

    return val(dsig) - val(0.0)


if __name__ == "__main__":
    WIDTHS = [5, 8, 11, 14, 18, 22, 28, 36, 45]

    print("=== one for one is short vega ===")
    print(f"{'strikes':>12}{'vega 1 stg':>12}{'net vega 1:1':>14}"
          f"{'net volga 1:1':>15}{'strangles for 0':>17}")
    for h in WIDTHS:
        b = spread(h)
        print(f"{b['kl']:5.0f}/{b['kh']:<6.0f}{b['vega_1']:12.2f}"
              f"{b['vega_net_1x1']:14.2f}{b['volga_net_1x1']:15.1f}{b['lam']:17.2f}")

    print("\n=== vega matched: what you actually own ===")
    print(f"{'strikes':>12}{'lambda':>9}{'vega':>8}{'volga':>9}{'gamma':>10}"
          f"{'put IV':>9}{'call IV':>9}{'credit':>9}{'theta/day':>11}")
    for h in WIDTHS:
        b = spread(h)
        print(f"{b['kl']:5.0f}/{b['kh']:<6.0f}{b['lam']:9.2f}{b['vega_net']:8.2f}"
              f"{b['volga_net']:9.0f}{b['gamma_net']:10.4f}"
              f"{b['iv_put']:8.1%}{b['iv_call']:9.1%}"
              f"{b['credit']:9.2f}{b['theta_net']:11.3f}")

    print("\n=== the quadratic vs the real reprice, at the peak ===")
    hstar = max(WIDTHS, key=lambda h: spread(h)["volga_net"])
    b = spread(hstar)
    print(f"peak at {b['kl']:.0f}/{b['kh']:.0f}, volga {b['volga_net']:.0f}")
    print(f"{'vol move':>10}{'0.5 x volga x dsig^2':>22}{'repriced':>12}{'gap':>8}")
    for dv in (0.02, 0.05, 0.10, 0.15):
        approx = 0.5 * b["volga_net"] * dv * dv
        real = repriced(hstar, dv)
        print(f"{dv:+10.0%}{approx:22.2f}{real:12.2f}{real - approx:8.2f}")

    print("\n=== vol regime: where the convexity lives ===")
    REGIMES = [0.12, 0.15, 0.18, 0.22, 0.28, 0.35]
    print(f"{'ATM vol':>9}" + "".join(f"{f'{S-h:.0f}/{S+h:.0f}':>11}" for h in WIDTHS))
    for atm in REGIMES:
        row = "".join(f"{spread(h, atm)['volga_net']:11.0f}" for h in WIDTHS)
        print(f"{atm:9.0%}{row}")
    print("\npeak width by regime")
    grid = np.arange(3.0, 45.1, 0.5)
    for atm in REGIMES:
        vals = [spread(float(h), atm)["volga_net"] for h in grid]
        k = int(np.argmax(vals))
        print(f"  ATM {atm:.0%}  peaks at {S-grid[k]:.0f}/{S+grid[k]:.0f}"
f" volga {vals[k]:.0f} lambda {spread(float(grid[k]), atm)['lam']:.2f}")The numbers above are internally consistent and every one of them comes out of the script on this page. Four things they do not capture.
The vega match is instantaneous. It holds at the point where you set it and nowhere else. Move spot 10% or vol 5 points and vega is no longer zero, so the position has to be re-ratioed to stay a pure convexity trade. Everything on this page describes the position at inception.
λ is a real constraint. Buying 7.51 strangles per straddle is workable. Buying 16.13 at 64/136 means sixteen times the bid ask, sixteen times the commission, and a fill risk that the model prices at zero. In practice the transaction cost curve rises faster than the volga curve past the peak, so the tradeable optimum sits slightly closer to the money than the theoretical one.
The deep wings are extrapolation. The smile is fitted to real quotes, but at 55/145 it implies 83% vol on the put, further out than anything actually listed in the chain it was fitted to. Treat the last row of every table as model output, not as a market price.
You are short gamma and paying theta. The credit at the open is not profit. A long convexity position in vol is financed by a short convexity position in spot, and the smile is what sets that price. If the underlying moves and vol does not, this trade loses.

I post the models as I build them, the changes I make to them, and the results that did not work. Shorter than these write ups, and there are a lot more of them.
Follow me on X