
From the gamma of one option to the whole SPX chain: net gamma, the gamma flip and the call and put walls, computed on 19,414 real contracts, then the one trading rule a GEX bot runs on the Interactive Brokers API.
Option dealers hedge the options they sell. When the index moves, their delta changes by gamma, and they trade the underlying to stay neutral. Gamma exposure adds that up across every contract: how many dollars of S&P 500 dealers have to buy or sell for each 1% move in the index.
Its sign is what matters. When dealers are long gamma, they sell rallies and buy dips, which damps the market. When they are short gamma, they buy rallies and sell dips, which pushes moves further. GEX became popular with the rise of zero day options: in July 2026 a record two thirds of SPX options volume expired the same day it traded, so this hedging flow is now a real force on the index.
Step by step, the page builds:
Numbers below come from the chain on 18 September 2026 13:10 New York time, a monthly expiry. Only numpy, pandas and matplotlib are needed. Read the limitations before quoting a number here. The dealer side is an assumption, not data.
The video walks through every step on a live dashboard, then runs the trading engine on an Interactive Brokers paper account: regime, decision, order, fill and result.
I post the models as I build them, the changes I make to them, and the results that did not work. Shorter than these write ups, and there are a lot more of them.
Follow me on X


Sections below compute gamma exposure step by step, with the formulas, the charts and the code. Two repositories go with them: the trading engine, with the regime, the decision and the Interactive Brokers execution, and the charts and models, including the same day expiry analysis.
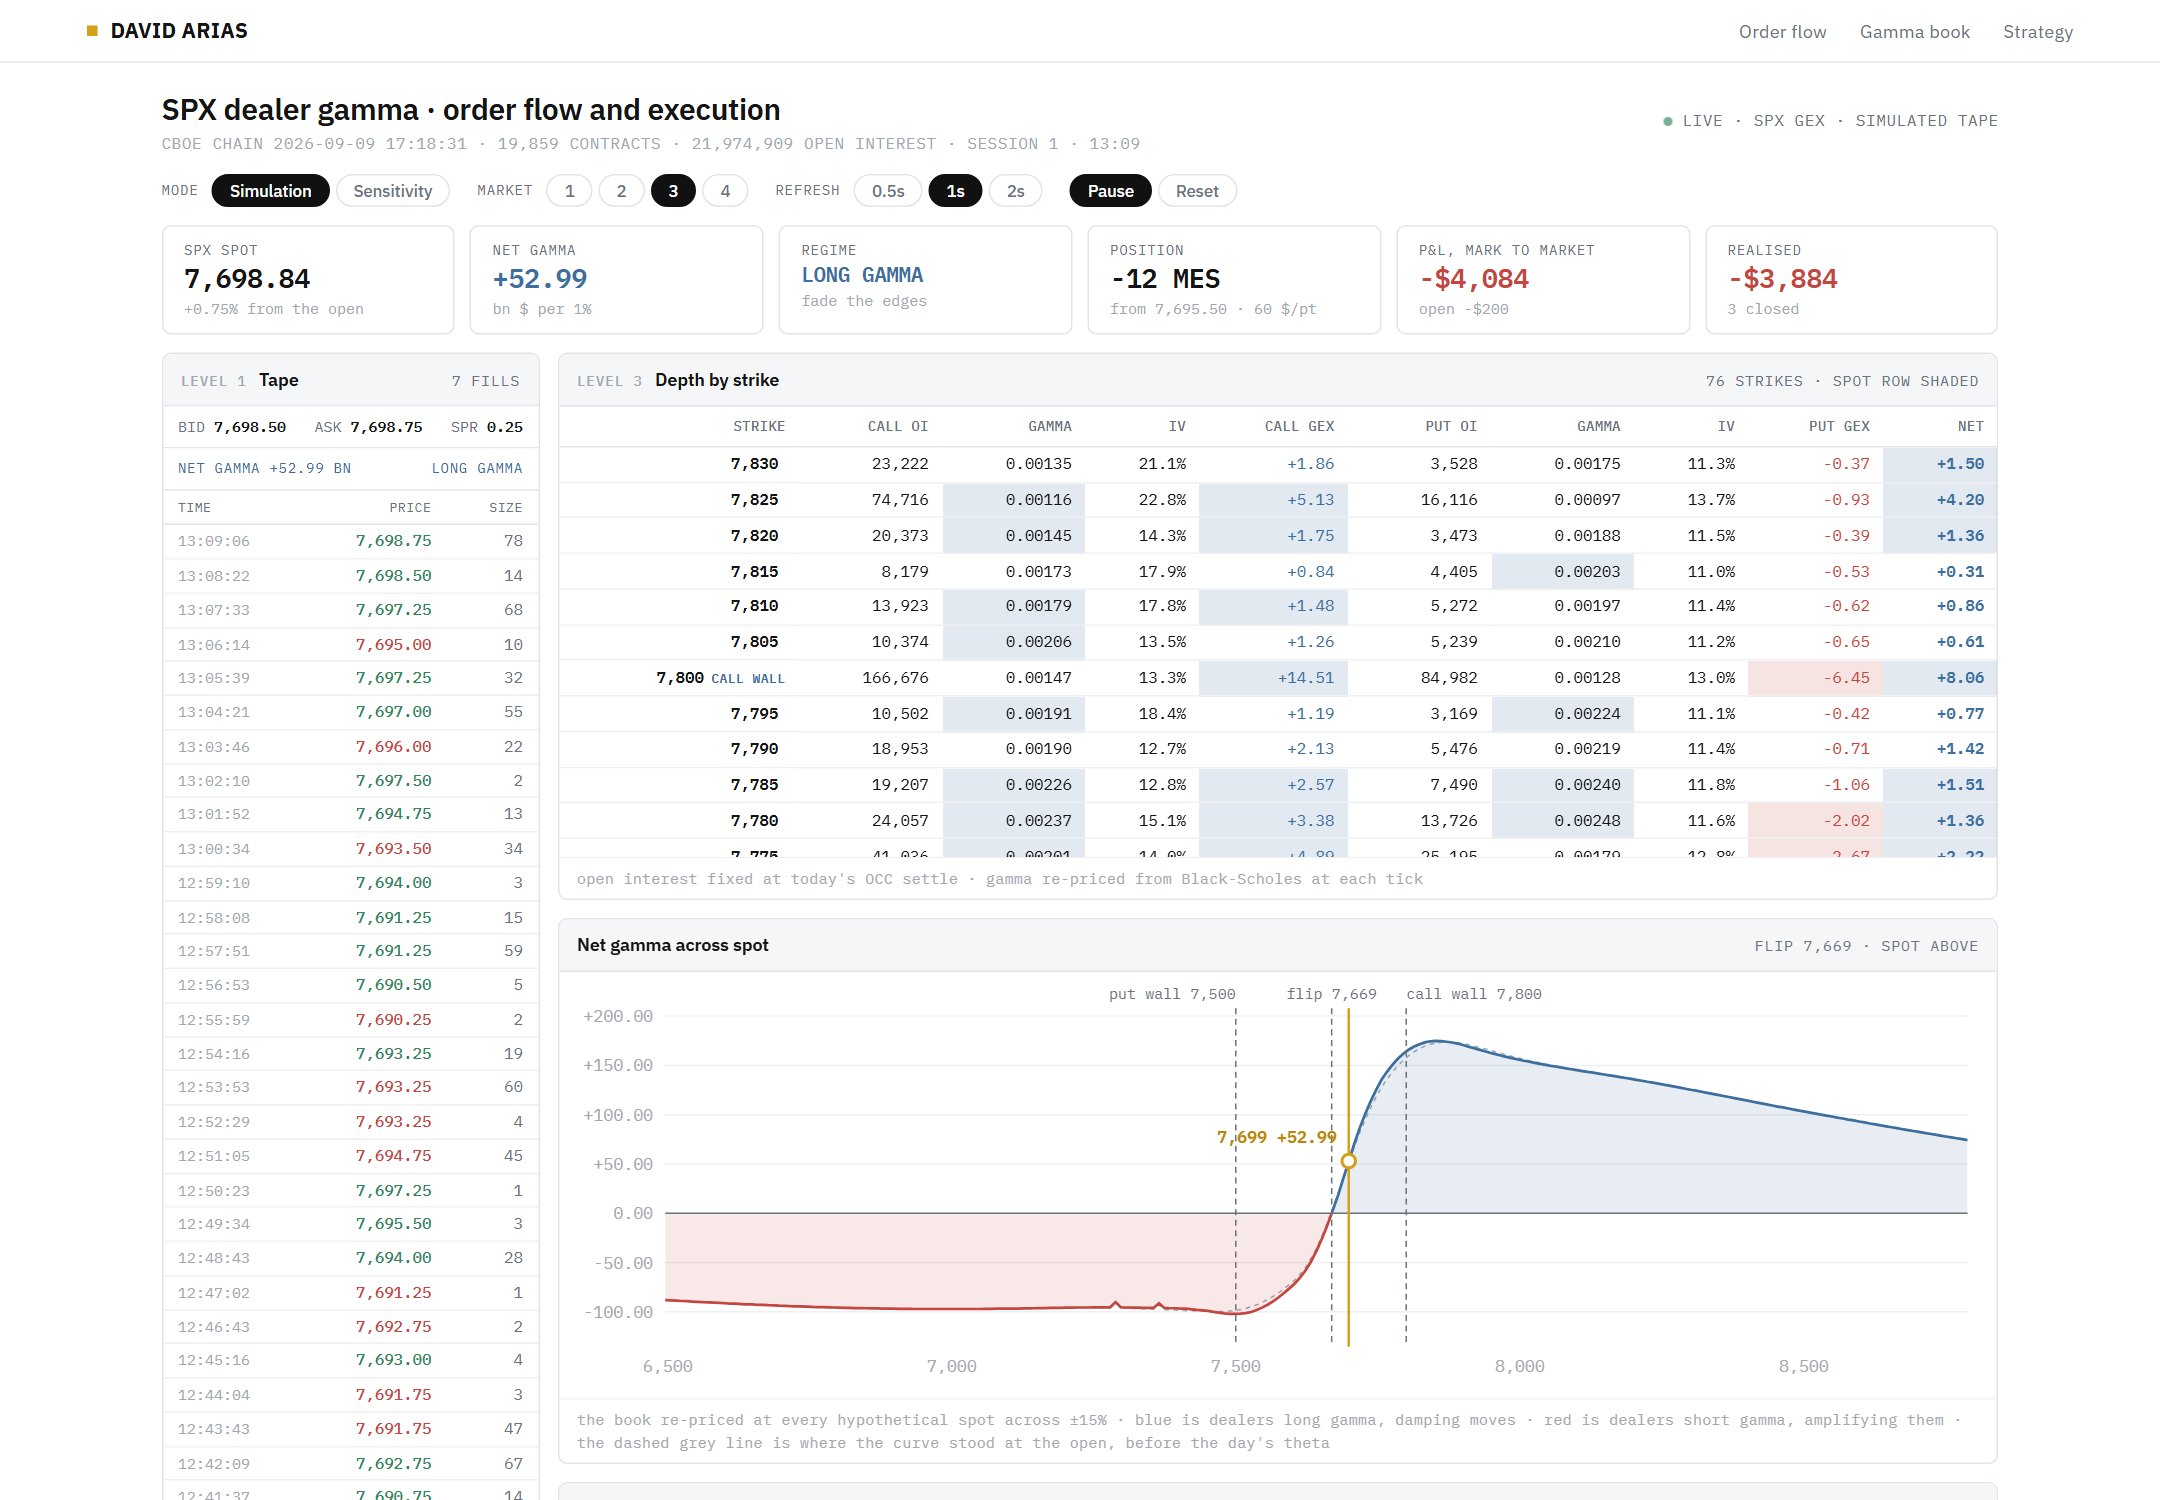
Everything on this page, running at once: the SPX tape, depth by strike with gamma and GEX for calls and puts, net gamma across spot with the flip and both walls, and a strategy P&L with its correlation matrix. A sensitivity mode moves spot, implied volatility, time to the close and same day open interest, and shows how the flip and the walls shift. It runs on a stored Cboe chain with a simulated tape.
Gamma is how fast an option's delta changes when the index moves. Black-Scholes gives it in closed form:
Γ = φ(d1) / (S σ √T) with d1 = [ ln(S/K) + (r + σ²/2) T ] / (σ √T)Multiply by open interest and 100 shares per contract and you get how much delta the dealers' book changes by per point. Multiply by S² × 1% and it becomes dollars of index to trade per 1% move. Calls enter positive and puts negative, on the standard assumption that dealers are long the calls and short the puts that customers trade:
GEX = Γ × OI × 100 × S² × 0.01 × (+1 for calls, −1 for puts)gex.py
R = 0.04                      # flat rate for Black-Scholes
MULTIPLIER = 100              # shares per SPX contract
MIN_T = 4 / (365 * 24)        # floor of four hours, so a contract expiring today stays finite


def bs_gamma(S, K, T, sigma):
    """Black-Scholes gamma, vectorised over K, T and sigma."""
    T = np.maximum(np.asarray(T, float), MIN_T)
    sigma = np.maximum(np.asarray(sigma, float), 1e-4)
    d1 = (np.log(S / np.asarray(K, float)) + (R + 0.5 * sigma ** 2) * T) / (sigma * np.sqrt(T))
    return np.exp(-0.5 * d1 ** 2) / (np.sqrt(2 * np.pi) * S * sigma * np.sqrt(T))


def gex(S, K, T, sigma, oi, is_call):
    """Dollars dealers trade per 1% move: calls positive, puts negative (dealers long calls, short puts)."""
    sign = np.where(is_call, 1.0, -1.0)
    return sign * bs_gamma(S, K, T, sigma) * oi * MULTIPLIER * S ** 2 * 0.01
One real contract, the largest call at the call wall: the 8,100 call expiring 2026-12-31, open interest 41,378, implied volatility 12.1%, with spot at 7,637.76.
0.000632 × 41,378 × 100 × 7,637.76² × 0.01 = $1.53 bnThat one line of the chain means dealers trade about $1.5 billion of S&P for every 1% the index moves.
Cboe publishes the full SPX chain as a single free JSON file, every strike and expiry with open interest and implied volatility, delayed about 15 minutes. Contract names follow the OCC format, so a regular expression recovers expiry, side and strike. Contracts with no open interest, no volatility or strikes more than 50% away from spot are dropped.
fetch_chain.py
CHAIN = "https://cdn.cboe.com/api/global/delayed_quotes/options/_SPX.json"
OCC = re.compile(r"^(?P<root>[A-Z]+)(?P<ymd>\d{6})(?P<side>[CP])(?P<strike>\d{8})$")


def fetch_chain():
    raw = json.loads(urllib.request.urlopen(
        urllib.request.Request(CHAIN, headers={"User-Agent": "gex-research"}), timeout=90).read())
    rows = []
    for o in raw["data"]["options"]:
        m = OCC.match(o["option"])
        if m:
            rows.append(dict(expiry=date(2000 + int(m["ymd"][:2]), int(m["ymd"][2:4]), int(m["ymd"][4:])),
                             is_call=m["side"] == "C", strike=int(m["strike"]) / 1000,
                             oi=float(o["open_interest"]), iv=float(o["iv"])))
    df = pd.DataFrame(rows)
    spot = float(raw["data"]["current_price"])
    df["T"] = [(e - date.today()).days / 365 for e in df.expiry]
    keep = (df["T"] >= 0) & (df.oi > 0) & (df.iv > 0.01) & (np.abs(np.log(df.strike / spot)) < 0.5)
    return df[keep].reset_index(drop=True), spot, raw.get("timestamp", datetime.now().isoformat(timespec="minutes"))
On 18 September 2026 13:10 that returns 19,414 contracts across 56 expiries, with SPX at 7,637.76.
Net gamma is every contract's GEX added together:
Net GEX(S) = Σi signi × Γi(S) × OIi × 100 × S² × 0.01net_gamma.py
def net_gamma(df, S):
    x = gex(S, df.strike, df["T"], df.iv, df.oi, df.is_call)
return x.sum(), x| Book | GEX |
|---|---|
| Every call | +242.3 |
| Every put | −233.0 |
| Net gamma | +9.4 |
Two books of about 240 billion each cancel almost exactly, and what is left, +9.4 billion, is positive: dealers are long gamma at this spot. Small as it looks next to either side, the sign of that residual is what decides whether hedging damps or amplifies the next move.
Group the same numbers by strike. Above spot, the strike with the largest positive GEX is the call wall. Below spot, the strike with the most negative GEX is the put wall. They mark where the most dealer hedging is parked.
walls.py
def walls(df, per_contract, spot):
    by_strike = pd.Series(per_contract).groupby(df.strike).sum()
    above, below = by_strike[by_strike.index > spot], by_strike[by_strike.index < spot]
    return by_strike, float(above.idxmax()), float(below.idxmin())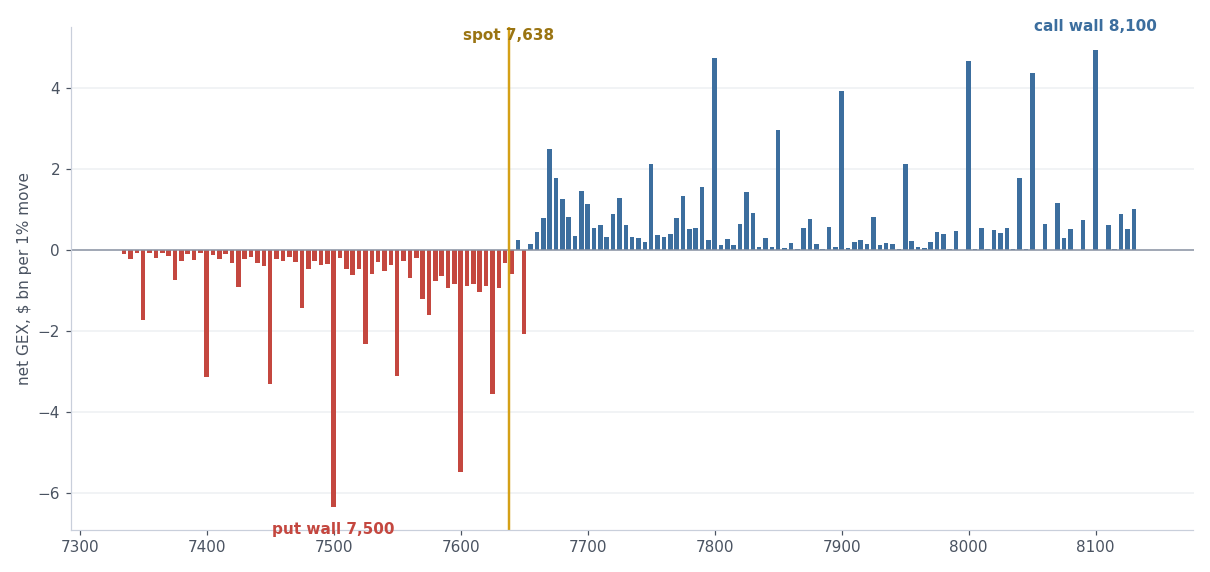
Below spot the book is almost all red: the put side dominates. Above it, calls take over. Here the call wall sits at 8,100 and the put wall at 7,500.
Net gamma only holds at today's price. Re-price every contract as if the index were somewhere else, add again, and repeat across a grid of levels: that draws net gamma across spot. Where it crosses zero is the gamma flip:
S* such that Net GEX(S*) = 0gamma_flip.py
def profile(df, spot, lo=0.90, hi=1.10, n=161):
    """Net gamma at every hypothetical spot: re-price every contract, add again."""
    grid = np.linspace(spot * lo, spot * hi, n)
    total = np.array([net_gamma(df, S)[0] for S in grid])
    return grid, total


def flip_level(grid, total, spot):
    """Zero crossing of the profile closest to spot, by linear interpolation."""
    best = None
    for i in range(len(grid) - 1):
        a, b = total[i], total[i + 1]
        if (a < 0 <= b) or (a > 0 >= b):
            x = grid[i] + (grid[i + 1] - grid[i]) * (-a) / (b - a)
            if best is None or abs(x - spot) < abs(best - spot):
                best = x
    return best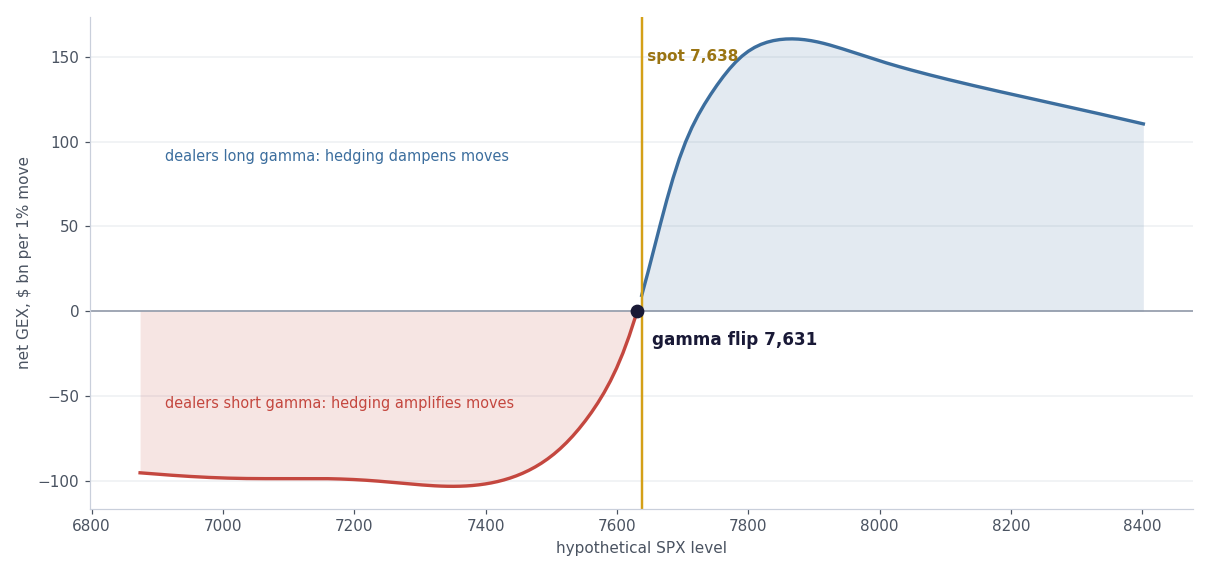
Here the flip sits at 7,631, and SPX at 7,638 is only 7 points above it. Just above the flip, dealers are long gamma but only barely: a 0.1% drop would put them short, and the same hedging that damps moves today would start to amplify them.
Most GEX rules online treat the flip and the walls as support and resistance. Tested day by day, those did not hold up. One rule did, and it comes from research: Baltussen, Da, Lammers and Martens, Hedging demand and market intraday momentum, Journal of Financial Economics, 2021. The last half hour of trading continues the day, and on the S&P 500 only when dealers are short gamma. Barbon and Buraschi, Gamma Fragility (2021), find moves tend to reverse when dealers are long gamma.
| Dealer gamma at the previous close | Market up | Market down |
|---|---|---|
| Short gamma | buy | sell |
| Long gamma | sell | buy |
Always the same side as the dealer hedge. A flat day means no trade.
| Test | Sharpe |
|---|---|
| Rule above | 1.37 |
| Always with the day, ignoring gamma | −2.00 |
| Same rule on QQQ | 0.88 |
Gamma does all the work: the same trade without it loses money. Edge is small, though, about 3 basis points a day before costs, gone at 3 basis points of costs, and only 26 of 723 sessions opened in short gamma. For the regime the engine uses the free SqueezeMetrics daily series, the one the research was built on, and prints the Cboe number above as a cross-check, since the two can disagree in sign. Engine code, with the Interactive Brokers execution, is in the repository.
Inferring dealer gamma from gamma × open interest is debatable, and the weak point is the dealer sign. Open interest counts how many contracts are open, not who holds which side. Every contract has a buyer and a seller, and the formula simply guesses that dealers sit opposite customers, who by convention sell calls (covered calls, collars) and buy puts (protection). That guess is the +1 for calls, −1 for puts in the formula:
GEXi = dealer signi × Γi × OIi × 100 × S² × 0.01 with dealer sign = +1 (call), −1 (put)When customers buy calls instead, as in a speculative rally or in zero day options, or sell puts for income, dealers hold the opposite side and the true sign of that contract flips. Nothing in open interest shows it. Same day trades are missing too, since open interest only updates overnight.
So the dashboard and steps 1 to 5 use this estimate to explain the mechanics: it is simple, and it can be seen strike by strike. Our trading engine does not use it. It never computes GEX from the chain. It reads one published number a day, the SqueezeMetrics SPX net gamma at the previous close, and keeps only its sign:
regimet = sign( SqueezeMetrics GEX at the close of day t−1 ) rt = MES at 15:30 / MES at 09:30 − 1 positiont = +sign(rt) if short gamma (follow) −sign(rt) if long gamma (fade) contracts = floor( equity / (5 × MES price) )To be clear, SqueezeMetrics' own white paper starts from the same dealer assumptions, so the engine does not escape the debate. Three things change. It is one public series, fixed before the session opens, so there is no look ahead. It uses only the sign, never levels like the flip or the walls, which are where a wrong sign on a few big strikes does the most damage. And the rule was backtested on that same series, so whatever error the assumption carries is already inside the result above instead of hidden from it. Our Cboe number is printed next to it as a cross-check only; on the day of the video the two disagreed in sign.
Every number so far holds the clock still. Zero day options do the opposite: a same day contract loses hours, and its gamma, which only lives around its strike, gets narrower and taller as the close approaches. This step keeps spot, implied vols and every other expiry fixed, ages only the same day book from 6.5 hours to 0.1 hours to expiration, and re-prices the whole chain at every SPX level each time.
From here on, numbers come from a second run, on 1 October 2026, 13:38 New York, with a live same day expiry: 20,034 contracts in the chain, 363 of them expiring that day with 402,723 contracts of open interest, SPX at 7,662. Same day quotes with no usable vol borrow the next expiry's vol at the same strike. Code and charts are in the charts and models repository.
dealer_gamma_aged.py
def gamma(S, K, T, sigma):
    """Black-Scholes gamma (rate set to zero, it barely moves gamma over hours)."""
    srt = np.maximum(sigma, 1e-4) * np.sqrt(np.maximum(T, 0.05 / YEAR_H))
    d1 = np.log(S / K) / srt + 0.5 * srt
    return np.exp(-0.5 * d1 ** 2) / (np.sqrt(2 * np.pi) * S * srt)


def dealer_gex(df, iv, S, hours, sign=None):
    """$ dealers trade per 1% SPX move, per contract. Default sign: dealers long calls, short puts.
    Same day contracts get `hours` to expiration, every other expiry keeps its days."""
    T = np.where(df.same_day, hours / YEAR_H, df.days / 365)
    sign = np.where(df.is_call, 1.0, -1.0) if sign is None else sign
    return sign * gamma(S, df.strike.to_numpy(), T, iv) * df.oi.to_numpy() * MULTIPLIER * S * S * 0.01


def profile(df, iv, grid, hours, sign=None):
    """Net dealer gamma at every hypothetical SPX level: re-price the whole book, add it up."""
    return np.array([dealer_gex(df, iv, S, hours, sign).sum() for S in grid])


def flip(grid, total, spot):
    """Zero crossing of the profile closest to spot."""
    best = None
    for i in range(len(grid) - 1):
        a, b = total[i], total[i + 1]
        if (a < 0 <= b) or (a > 0 >= b):
            x = grid[i] + (grid[i + 1] - grid[i]) * (-a) / (b - a)
            best = x if best is None or abs(x - spot) < abs(best - spot) else best
    return best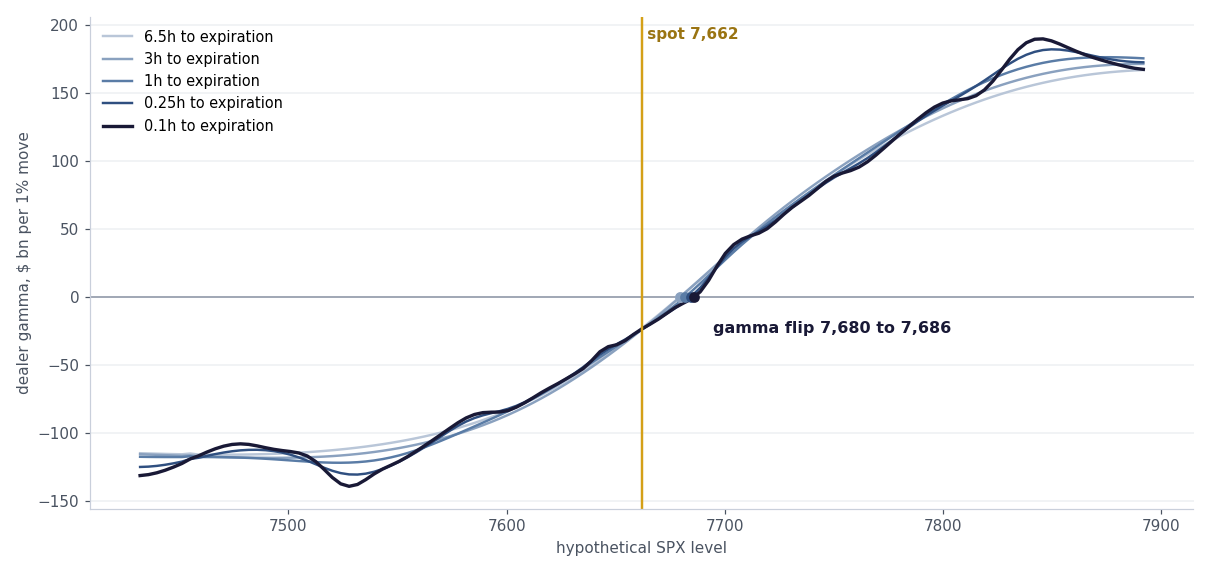
| Hours to expiration | Gamma flip | Dealer gamma at spot |
|---|---|---|
| 6.5 | 7,680 | −23.2 |
| 3 | 7,680 | −24.2 |
| 1 | 7,682 | −24.2 |
| 0.25 | 7,684 | −24.0 |
| 0.1 | 7,686 | −23.7 |
On this day the flip drifts only from 7,680 to 7,686, and gamma at spot barely moves, because most of the book sits in other expiries. Where the same day expiry shows is the shape: in the last minutes the curve turns jagged, each wiggle a same day strike whose gamma has shrunk into a spike a few points wide.
Splitting only the same day expiry by strike shows where its gamma sits. With hours left it spreads across more than a hundred points of strikes. Near the close only the strikes within a few points of spot keep any: an option's gamma at spot fades once spot sits more than about one standard deviation of the remaining move away from its strike, and with six minutes left that is a handful of points.
same_day_by_strike.py
def same_day_by_strike(df, iv, spot, hours):
    sd = df.same_day.to_numpy()
    x = pd.Series(dealer_gex(df, iv, spot, hours)[sd]).groupby(df.strike[sd].to_numpy()).sum()
    return x / 1e9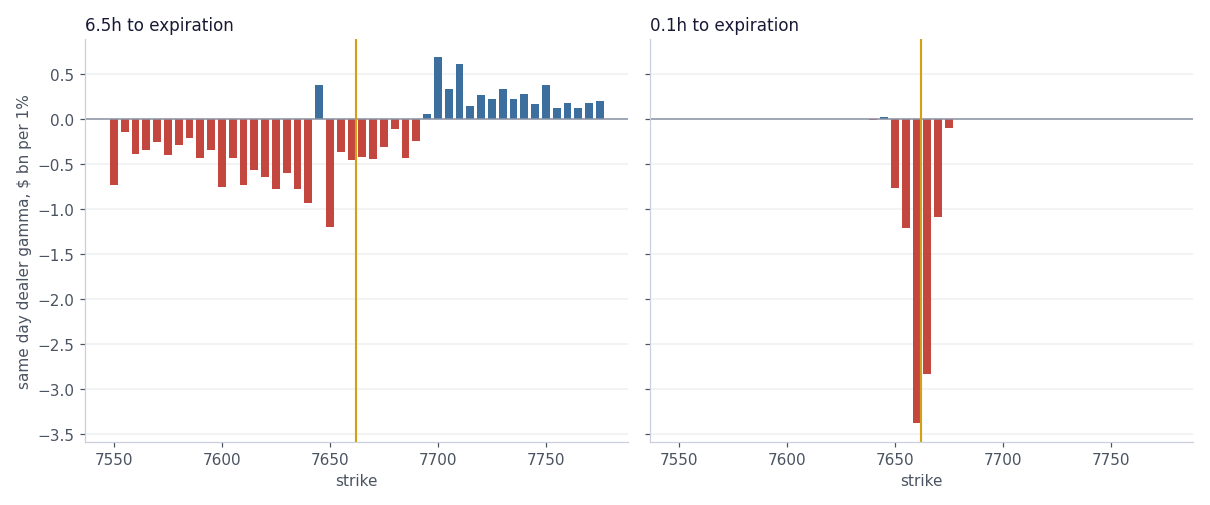
Under the dealer convention the same day puts around spot dominate, which is why most bars point down.
GEX is quoted per 1% move: gamma times S² times 1%, a straight line drawn from gamma. Weeks from expiry that line is fine. Near expiry it breaks. At the biggest same day strike, 7,650 with 6,177 contracts, the 1% figure climbs from $3.4 billion with 6.5 hours left to $27.4 billion with 0.1 hours left. No hedge that size can exist: the whole strike, every contract at full delta, is 6,177 × 100 × 7,650 = $4.73 billion of SPX.
The exact figure is the change in delta for a realistic move. For a 0.25% move off the strike, about what SPX does in a last hour:
hedge = Σ OI × 100 × K × [ N(d1 at K(1 + 0.25%)) − N(d1 at K) ]hedge_for_move.py
MOVE = 0.0025             # a 0.25% move, about what SPX does in a last hour


def hedge_for_move(df, iv, K, hours, move=MOVE):
    """$ of SPX dealers must trade at strike K if SPX moves `move` off it: the exact change in delta.
    It can never pass the strike's whole delta, contracts x 100 x K."""
    m = (df.same_day & (df.strike == K)).to_numpy()
    srt = iv[m] * np.sqrt(hours / YEAR_H)
    d_on, d_off = 0.5 * srt, np.log(1 + move) / srt + 0.5 * srt
    return float(((norm.cdf(d_off) - norm.cdf(d_on)) * df.oi.to_numpy()[m] * MULTIPLIER * K).sum())


def linear_one_pct(df, iv, K, hours):
    """The usual GEX figure at the strike: gamma x S squared x 1%. Fine far from expiry, it explodes close to it."""
    m = (df.same_day & (df.strike == K)).to_numpy()
    return float((gamma(K, K, hours / YEAR_H, iv[m]) * df.oi.to_numpy()[m] * MULTIPLIER * K * K * 0.01).sum())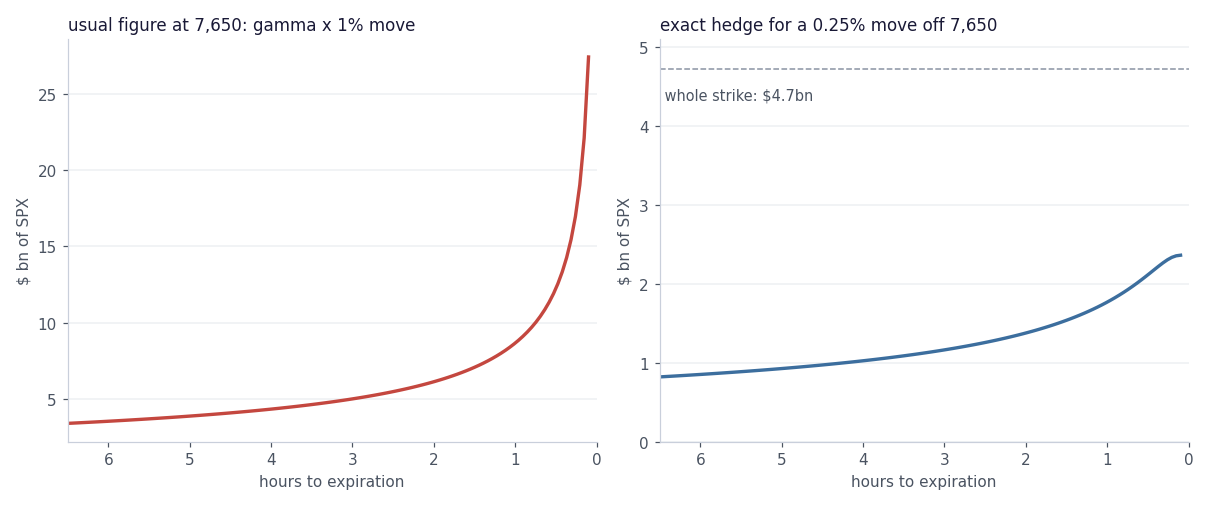
| Measure | 6.5 hours out | 0.1 hours out |
|---|---|---|
| Usual figure, gamma × 1% move | 3.4 | 27.4 |
| Exact hedge for a 0.25% move | 0.82 | 2.36 |
| Whole strike, contracts × 100 × strike | 4.73 | 4.73 |
The real hedge rises as the close nears and then flattens, because a 0.25% move can at most take an at the money same day option from 0.5 delta to nearly 1. Close to expiry, read any per 1% GEX figure as an upper bound that real hedging never reaches.
SqueezeMetrics publishes its own daily GEX estimate since 2011, free. Each dot below is one day: that day's GEX against the next day's SPX move, close to close. Their estimate has its own method and scale, so its numbers are not comparable with the chain figures above.
gex_next_day.py
SQUEEZE = "https://squeezemetrics.com/monitor/static/DIX.csv"


def squeeze_history():
    """SqueezeMetrics GEX (their own positioning estimate, their own scale) and the next close to close SPX move."""
    raw = urllib.request.urlopen(urllib.request.Request(SQUEEZE, headers={"User-Agent": "gex-research"}),
                                 timeout=60).read().decode()
    sq = pd.read_csv(io.StringIO(raw), parse_dates=["date"])
    sq["next"] = sq.price.pct_change().shift(-1) * 100
    sq["gex_bn"] = sq.gex / 1e9
    return sq.dropna(subset=["next"]).reset_index(drop=True)


def spreads(sq):
    short, long_ = sq[sq.gex < 0], sq[sq.gex > 0]
    calm = short[~short.date.dt.year.isin([2020, 2022])]
    return dict(days=len(sq), short_days=len(short), short=float(short.next.std()), long=float(long_.next.std()),
                short_without_2020_2022=float(calm.next.std()))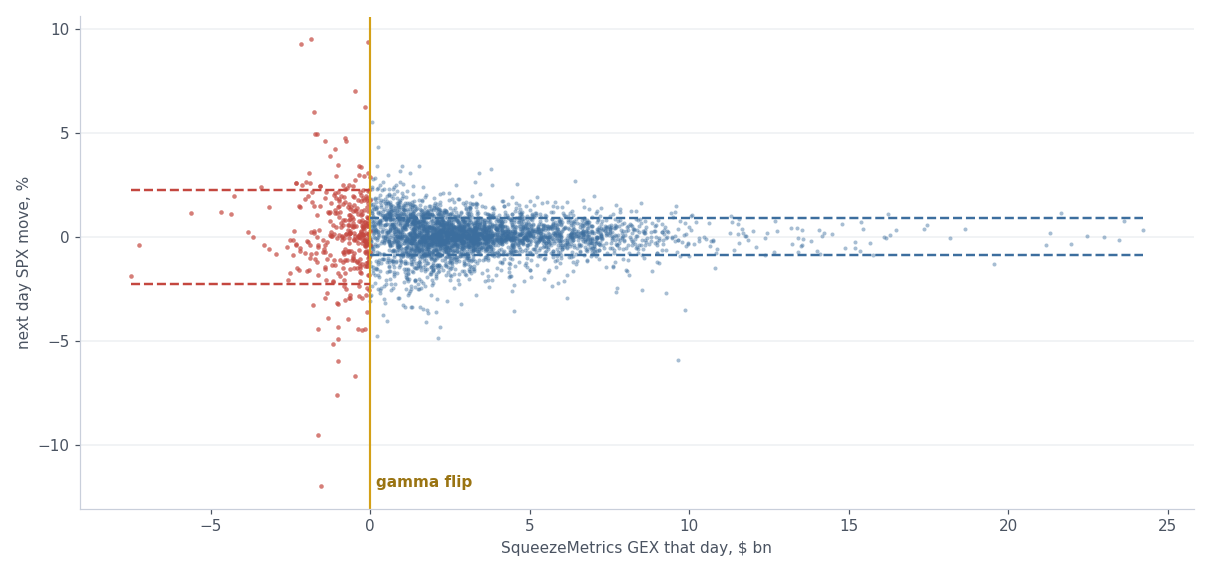
| Days | Count | Next day move |
|---|---|---|
| Negative GEX (dealers short gamma) | 347 | ±2.25% |
| Positive GEX (dealers long gamma) | 3,529 | ±0.89% |
| Negative GEX, without 2020 and 2022 | ±1.77% |
On negative GEX days the next day moved about 2.5 times as much. Part of that is volatile years: without 2020 and 2022 the spread is ±1.77%, still about twice the positive GEX days. GEX and volatility move together, and this chart shows the association without separating the two.
Every GEX figure on this page assumes dealers are long calls and short puts. The same day book is where that guess is weakest: zero day flow runs both ways, and plenty of traders sell same day puts. Re-signing only the same day book, 6.5 hours to expiration, with everything else unchanged:
sign_scenarios.py
def sign_scenarios(df, iv, spot, hours):
    """Dealer gamma at spot under three views of who holds the same day book."""
    std = np.where(df.is_call, 1.0, -1.0)
    sd = df.same_day.to_numpy()
    netted = np.where(sd, 0.0, std)                           # same day flow two way, nets to zero
    puts_sold = np.where(sd & ~df.is_call.to_numpy(), 1.0, std)  # customers sold the same day puts
    return {name: float(dealer_gex(df, iv, spot, hours, s).sum() / 1e9) for name, s in
(("convention", None), ("same_day_nets_to_zero", netted), ("same_day_puts_sold", puts_sold))}| Who holds the same day book | Dealer gamma |
|---|---|
| Convention: dealers long calls, short puts | −23.2 |
| Same day flow two way, nets to zero | −14.3 |
| Customers sold the same day puts | +31.0 |
Same chain, same prices, and dealer gamma at spot lands anywhere from −23.2 to +31.0 billion depending on who holds the same day book. Read the sign of any GEX number, this one included, as an estimate.