Deep learning quietly rewrote how the street prices options, picks stocks, builds portfolios and calibrates volatility. Here are the five papers that did it, explained simply, each with a Python walkthrough you can run yourself.
For Deep Hedging below you'll find a link to a Python walkthrough where I adapt the paper's core idea into runnable code to explain how it works. More adaptations are on the way.
Every options desk hedges with the Black-Scholes delta. The problem: Black-Scholes assumes a frictionless world with no trading costs, no market impact and continuous rebalancing. Reality has all three, and they quietly eat the profit.
Deep Hedging throws the formula out. It hands a neural network the job directly: given the market state, decide how much to trade at each step to hedge the payoff, while being penalised for the cost of every trade. The network learns a hedging strategy, not a closed-form Greek, so it naturally trades less when costs are high and still lands close to the target payoff.
No Black-Scholes formula. The network simply learns the cheapest way to stay hedged.
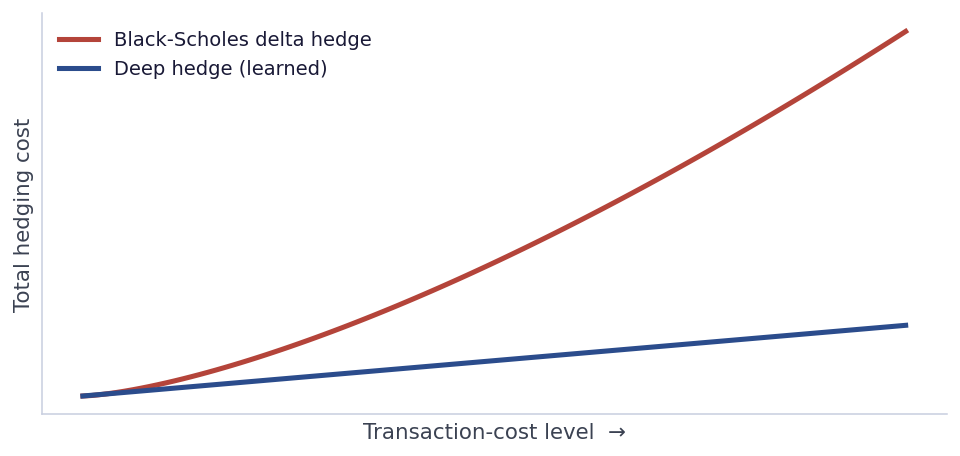
I made an adaptation of this in Python to explain some of the paper's key ideas: a small neural network hedging a call option under transaction costs in a simulated market, set against the Black-Scholes benchmark. See the Python walkthrough
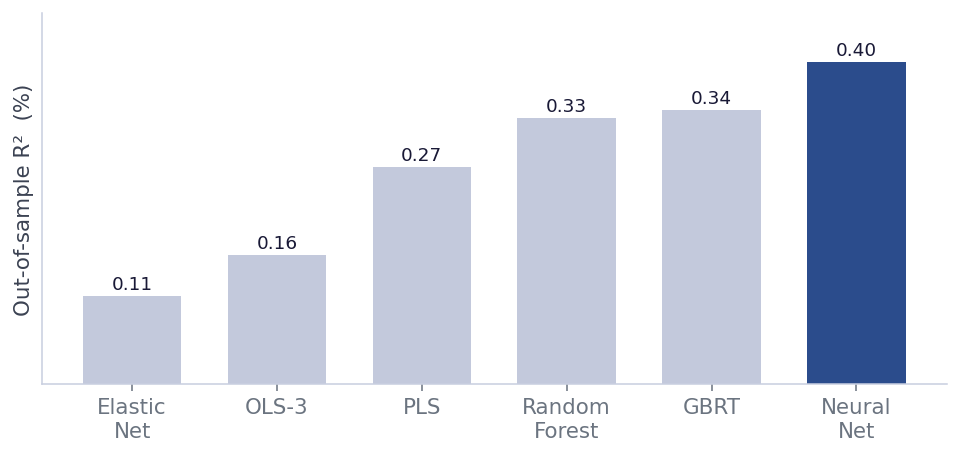
Predicting stock returns has always been finance's hardest game. For decades the toolkit was linear regression on a handful of factors. This paper ran the biggest bake-off yet: dozens of predictors, thousands of stocks, sixty years of data, and every method from plain regression to boosted trees and neural networks put head to head, out of sample.
The verdict was decisive. The flexible machine-learning models, especially trees and neural networks, roughly doubled the out-of-sample predictive power of the linear benchmarks, mostly by capturing interactions and nonlinearities the old models simply couldn't see.
Trees and neural networks roughly double the predictive power of the old linear models.
Markowitz's mean-variance optimiser is elegant and famously fragile. To find weights it has to invert the covariance matrix, and when assets are correlated that inversion blows tiny estimation errors up into enormous, unstable positions that fall apart out of sample.
Hierarchical Risk Parity fixes this with tools from machine learning and graph theory. It turns correlations into distances, clusters assets that move together into a tree, and splits risk down the branches. No optimiser, no matrix inversion, so estimation noise is never amplified, and weights only shift among peers inside the same cluster.
Same information, no matrix inversion, and yet the lowest out-of-sample risk of the three.
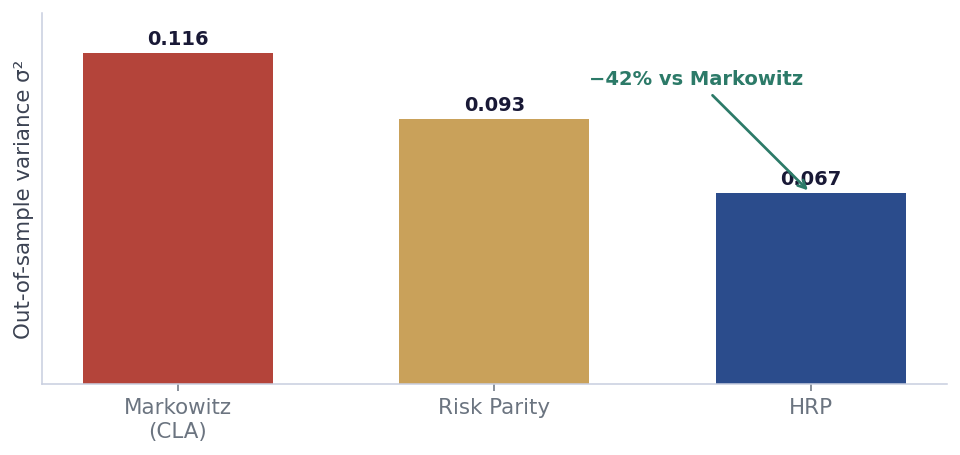
I built a Python walkthrough of this: a Monte Carlo test that pits Hierarchical Risk Parity against Markowitz's mean-variance optimiser to see which portfolio actually holds up out of sample. See the Python walkthrough
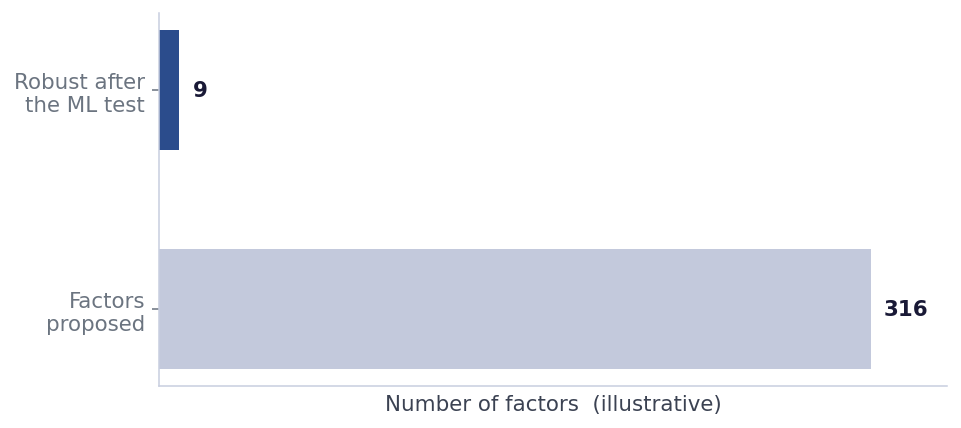
Academics have published hundreds of "factors" that supposedly explain stock returns, so many that the field nicknamed it the factor zoo. The trouble is that with enough data-mining, almost any factor can look significant on its own. Which ones are actually new?
This paper brings statistical discipline to the question. It uses a machine-learning technique (double-selection LASSO) to ask, for any newly proposed factor, whether it adds explanatory power beyond the factors we already know, while correcting for the model-selection mistakes that fool naive tests. The answer: most of the zoo is redundant, and only a handful of factors genuinely survive.
Hundreds of factors, but only a handful survive once you control for what we already know.
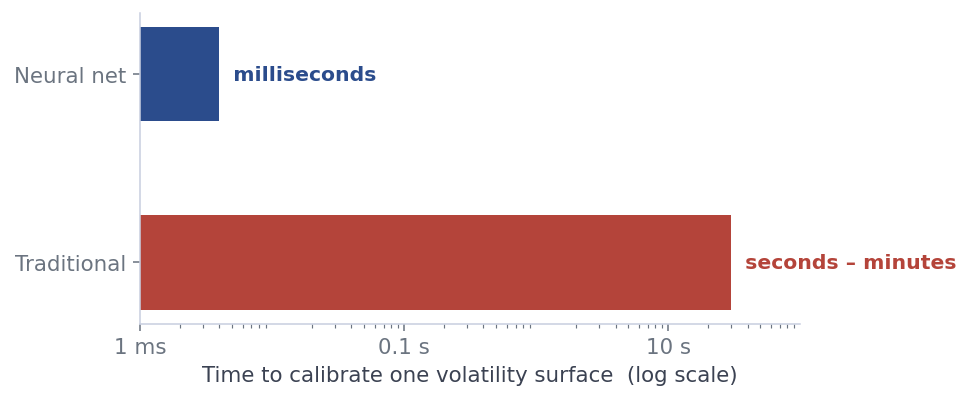
Modern "rough" volatility models fit market option prices beautifully, but they are painfully slow to calibrate: fitting one to the day's implied-volatility surface can take seconds to minutes of heavy computation, which is a problem when you need to re-price a book in real time.
The trick here is to train a neural network once, offline, to learn the map from model parameters to the whole implied-volatility surface. At run time, calibration becomes a near-instant lookup: the network spits out the surface in milliseconds, turning an overnight-grade computation into something you can do live, thousands of times a second.
Train once, offline. Then calibrate the whole surface in milliseconds instead of minutes.
These five papers turned deep learning from a curiosity into standard quant infrastructure: hedging, pricing, portfolio construction and calibration. Each write-up above links to my own Python reproduction, so you can run the ideas, not just read them.